Bollinger Width
Bollinger Width
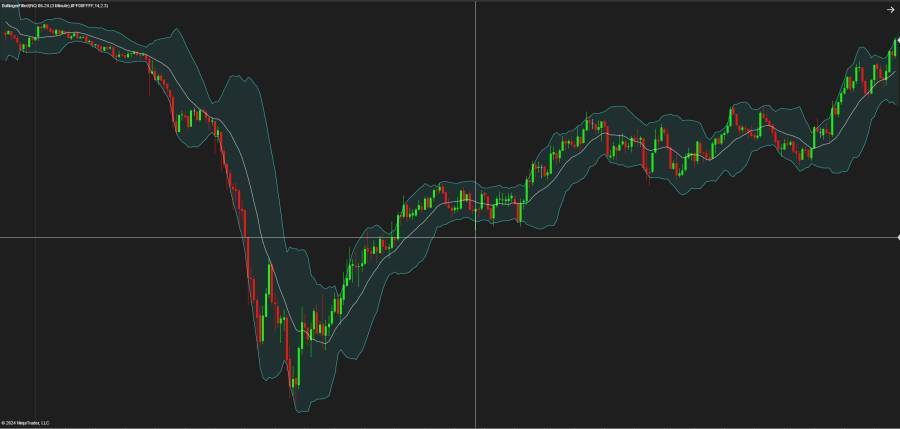
The Bollinger Width Indicator is a technical analysis tool that can provide unique insights into market volatility. Derived from the Bollinger Bands, which consist of a moving average and two standard deviation lines (bands) above and below it, the Bollinger Band Width measures the distance, or width, between these bands.
![]() What is Bollinger Width?
What is Bollinger Width?
Bollinger Width quantifies the gap between the upper and lower Bollinger Bands. This gap widens with increasing market volatility and narrows during less volatile periods. It’s a simple metric calculated by subtracting the lower band from the upper band and can often be represented as a separate chart below the main price chart.
Significance in Trading
1. Volatility Measurement: Bollinger Band Width serves as a direct measure of volatility. A high value indicates high volatility, while a low value suggests low volatility.
2. Market Dynamics: Traders can infer potential market moves. For instance, markets often alternate between periods of high volatility and consolidation; narrow bands can sometimes precede significant price breakouts.
3. Trend Identification: In conjunction with the main Bollinger Bands, the width can help identify the strength of a trend. Expanding width in a trending market suggests the trend may continue.
Trading Strategies Using Bollinger Width
1. Volatility Breakouts: Traders may look for periods when the width is at a relative low, signaling a potential volatility breakout. A sudden increase in the width could indicate the start of a new trend.
2. Trend Continuation: In a trending market, increasing Bollinger Width suggests that the trend is strong and likely to continue.
3. Oscillation Trades: In a ranging market, traders might use the width to trade oscillations between the bands.
Example of Application
Consider an instrument trading within a tight range. The Bollinger Width would be relatively narrow, signaling low volatility. A breakout from this range would be accompanied by a widening of the bands, and accordingly, an increase in the Bollinger Width would signal this change to traders.
Bollinger Width is best known for identifying The Squeeze. This occurs when volatility falls to a very low level, as evidenced by the narrowing bands. The bands narrow as price flattens or moves within a relatively narrow range. The theory is that periods of low volatility are followed by periods of high volatility. Relatively narrow Band Width (a.k.a. the Squeeze) can foreshadow a significant advance or decline. After a Squeeze, a price surge and subsequent band break signal the start of a new move. A new advance starts with a Squeeze and subsequent break above the upper band. A new decline starts with a Squeeze and subsequent break below the lower band.

Bollinger Width is a versatile indicator that can enhance a trader’s understanding of market volatility and potential price movements. Whether used on its own or as part of a more extensive trading system, it provides valuable insights into the ever-changing dynamics of financial markets. As always, traders should use this indicator in the context of other analyses and market conditions to make the most informed trading decisions.