T
Indicators starting with T
-
Tradeify
Tradeify Tradeify Funded Accounts: Everything You Need to Know Tradeify offers three distinct paths to traded capital: Advanced, Growth, and Straight-to-Sim funded accounts. Whether you’re an intraday scalper, a swing-trader holding positions overnight, or someone who just wants to jump straight into simulated capital, Tradeify has you covered—complete with clear rules, tiered payout policies, and a discipline-driven Consistency Rule. Use code PROPTRADERZ at checkout to automatically unlock the highest available discount whenever a sale is live—no extra steps, no limits! 1. Account Types Advanced, Growth, and Straight to Sim Funded: $25k Accounts: Up to 1 Contract (10 micros) $50k Accounts: Up to 5 Contracts (50 Micros) $100k Accounts: Up to 10 Contracts (100…
-
Trend Hunter Auto Strategy
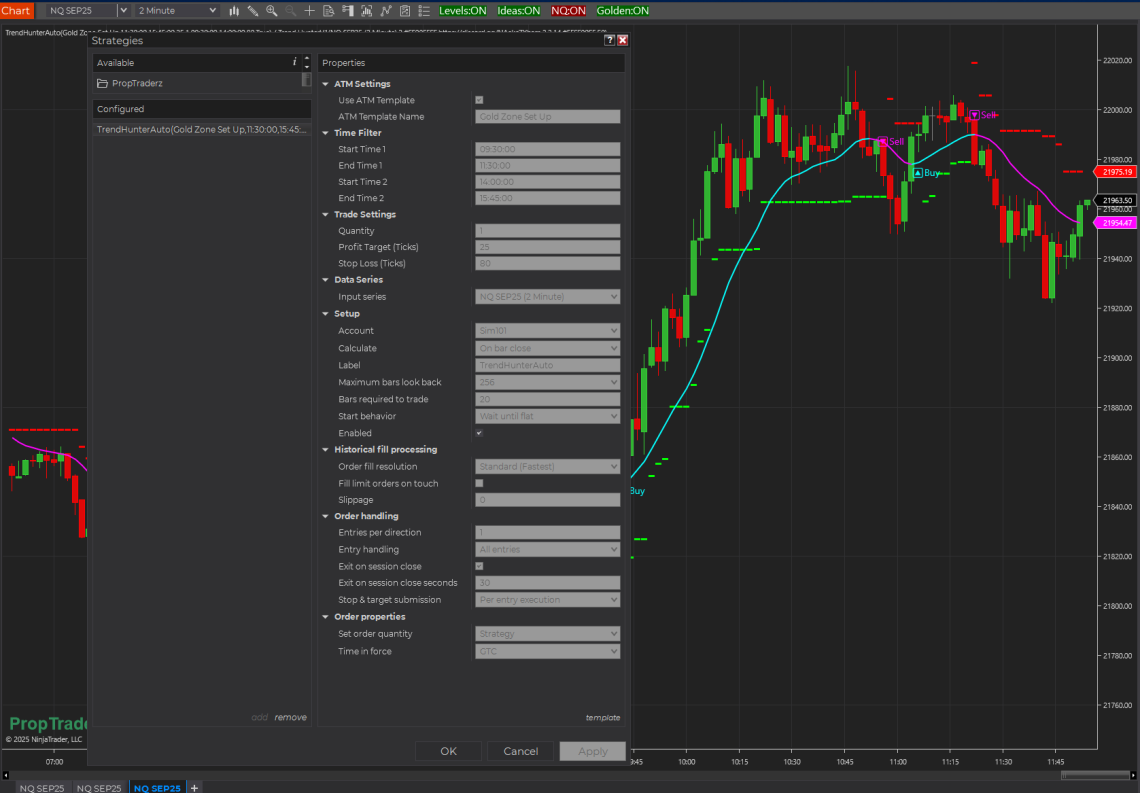
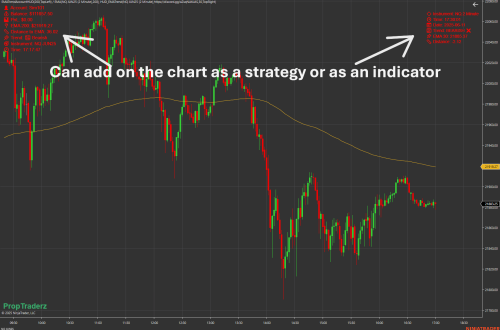
Trend Hunter Auto Strategy is a fully automated trading strategy built for NinjaTrader 8, designed to leverage the custom indicator TrendHunterV1 to identify trend-based long and short setups. Whether you’re an algorithmic trading enthusiast or just looking to automate your edge, this strategy offers robust execution flexibility — including traditional stop/target-based management or ATM Strategy integration. Let’s walk through exactly how it works. 🧠 How the Strategy Works 🎯 Core Logic: The TrendHunter Signal Engine At its heart, TrendHunterAuto relies on a custom indicator called TrendHunterV1, which generates directional signals: +1 → Long signal -1 → Short signal 0 → Neutral / no signal Every time a new bar is…
-
Trend Hunter: Heiken-Ashi + SuperTrend in One Indicator
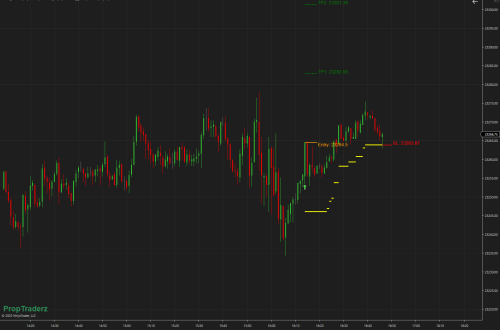
Trend Hunter is a NinjaTrader 8 overlay that combines smooth Heiken-Ashi mid-line logic with SuperTrend-style stop bands—and then drops clear “🔼Buy” or “🔽Sell” labels when your smoothed Heiken line and SuperTrend agree on direction. What It Does Heiken-Ashi Smoothing Uses two EMAs (default 14 and 2) to calculate a smoothed Heiken-Ashi mid-line. Faster EMA gives you sensitivity; slower EMA filters noise. SuperTrend Stop Logic Calculates upper/lower bands from ATR (default period 2) × Factor (default 2.0). Tracks whether price is above (bull trend) or below (bear trend) the bands. Entry Signals When the Heiken-Ashi mid-line direction (up/down) matches the SuperTrend direction, it draws a “🔼Buy” label below price or a…
-
Trend Surfer Pro
Trend Surfer Pro Indicator What Is the Trend Surfer Pro Indicator? The TrendSurfer Pro is a multi-layered trend-following indicator that merges two powerful technical analysis concepts: Trend Magic – A dynamic trend-following system based on CCI (Commodity Channel Index) and ATR (Average True Range) for adaptive trend detection. T3 Moving Averages – A set of four smoothed trend lines that filter out market noise and highlight momentum shifts. This combination allows traders to: ✅ Spot trends early with high accuracy ✅ Reduce false signals with adaptive filtering ✅ Customize sensitivity for different trading styles Key Features 1. Trend Magic System Automatically adjusts between bullish (blue) and bearish (red) trends Uses CCI + ATR to adapt to changing market volatility Plots a thick 3px trend line for clear visibility 2. Quad T3…
-
TrendScalperV1
Understand the Signals of TrendScalperV1 Indicator Dots: Buy Signal – Indicates upward momentum. Look for entries above this point. Dots: Sell Signal – Indicates downward momentum. Look for entries below this point. Arrow (Up): Buy Entry Point – Confirms a buy setup based on momentum and volatility. Arrow (Down): Sell Entry Point – Confirms a sell setup based on momentum and volatility. Dynamic Stop-Loss Management: Dashed Lines: Show ATR-based stop-loss levels for buy (aqua) and sell (red) trades. These adapt to market volatility to minimize risk. Follow the Visual Cues: Buy Signal Example: When a cyan dot appears, wait for the lime arrow to confirm entry. Sell…
You May Also Like

ICT FVG(fair value gap) & Pat Toolbar
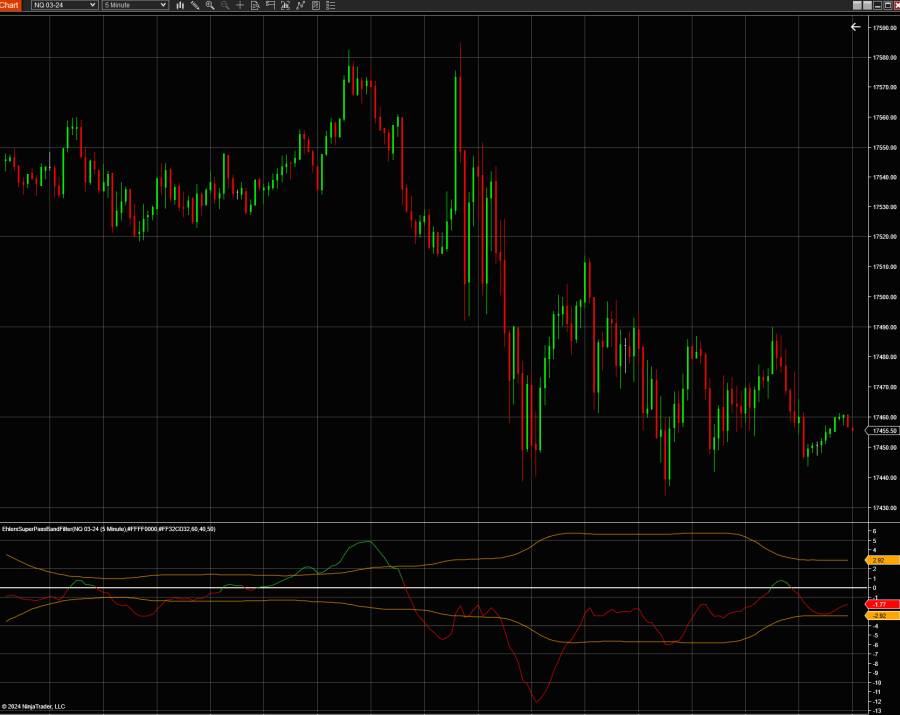
Super Passband Filter
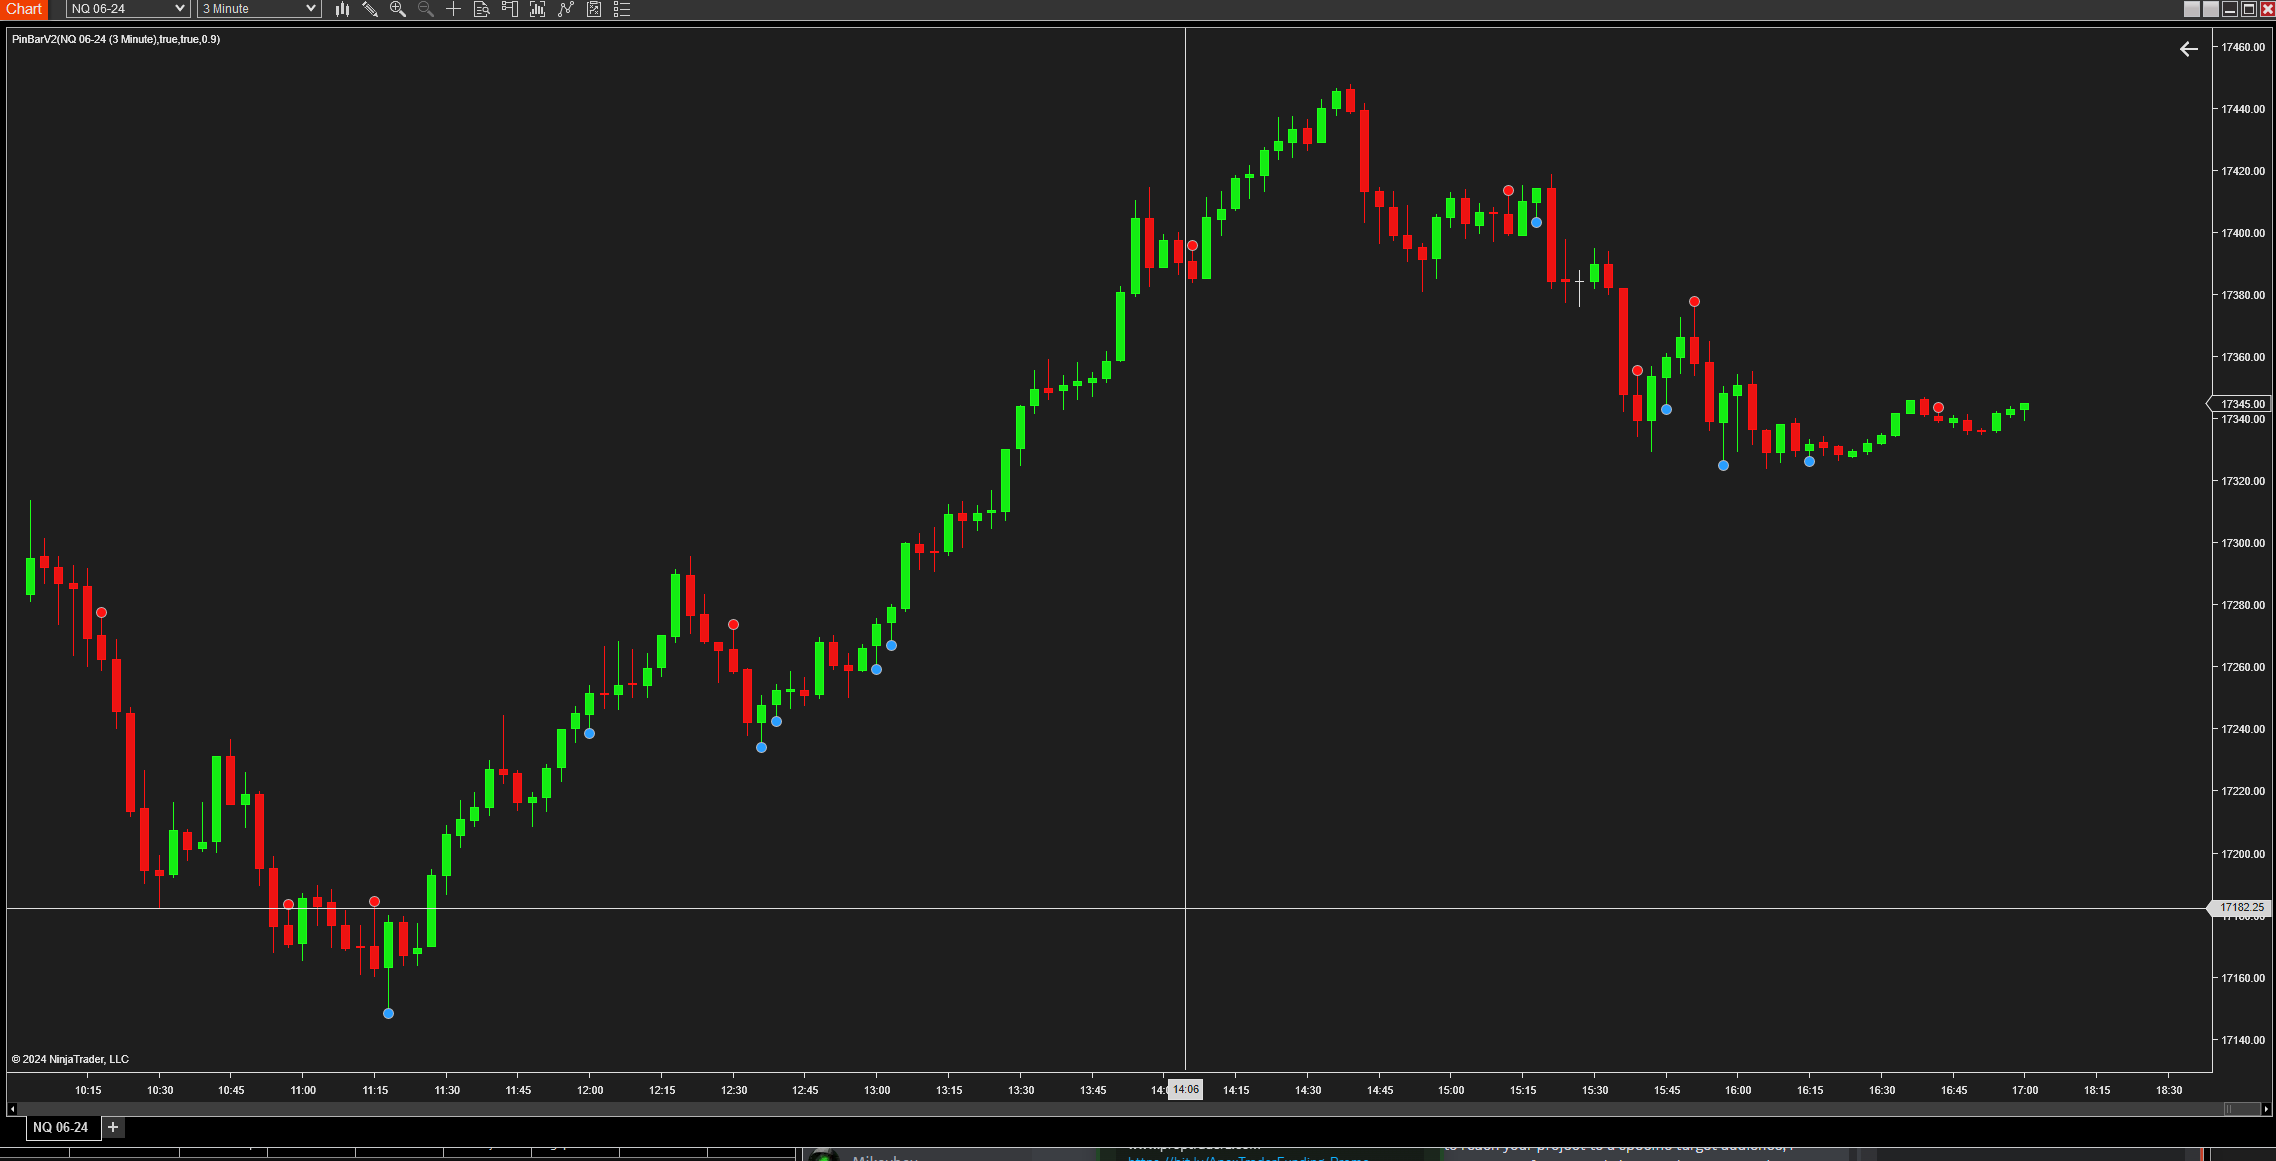
Pin Bar Free Indicator
-
Twin Range Filter Free Indicator
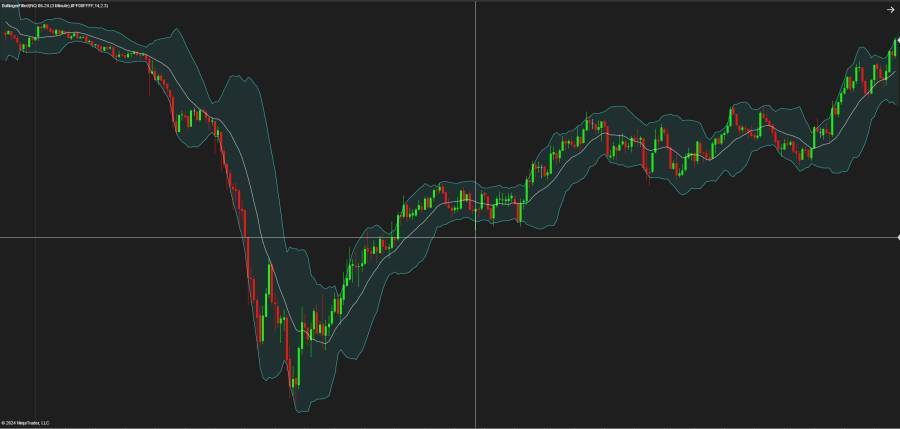
The “Twin Range Filter Free indicator for Ninja Trader” is essentially a trend-following logic combined with adaptive volatility filters. The indicator starts with a given price series, usually the close of each bar (the source). All calculations are based on this input. Same indicator for TradingView can be found HERE Range Trading Explained HERE Computing the Smoothed Range : The indicator calculates two “smoothed ranges” based on two different periods (a fast period and a slow period) and then averages them. Fast Range: Uses a shorter period and a multiplier to measure recent volatility. Slow Range: Uses a longer period and a multiplier to gauge a more extended…
-
Trade Detector V2 Free
Functionality: Transaction Detection: TradeDetectorV2’s core function is to identify and display major transactions within a very short timeframe at specific price levels. It particularly focuses on limit orders where large volumes are traded at the same price. It classifies the magnitude of these transactions using three different volume thresholds (500, 1000, and 1500(customizable)). It is recommended when switching from Minis to Micros to increase the volume threshold Visual Signals: When a significant transaction is detected, the indicator visually marks this event on the chart with: Dots: Colored green for bullish transactions (buying) and purple for bearish ones (selling). Lines: These extend from the transaction price to the current median…
-
Trade Detector Indicator Free
Key Features The Trade Detector indicator offers several customizable features to suit your trading needs: Transaction Volume Threshold: Specify the minimum volume for a transaction to be considered significant. Time Interval: Set the maximum allowable time gap between consecutive transactions to detect rapid, large trades. Visual Alerts: Customize dot colors and line colors for buy and sell transactions. Sound Alerts: Configure different sound alerts for buy and sell transactions. Text Display: Choose to display the transaction time or volume directly on your chart. How It Works The Trade Detector indicator analyzes transaction data in real-time to identify large trades that meet your specified criteria. Here’s a detailed breakdown of how…
-
Trend QQE Free
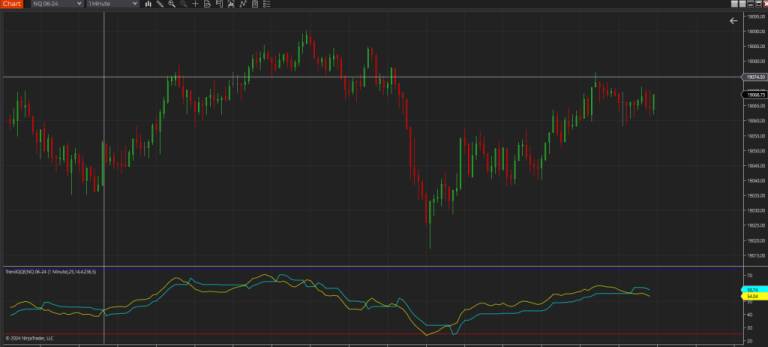
Trend QQE FREE Quantitative Qualitative Estimation (QQE) indicator is a smoother version of the popular Relative Strength Index (RSI) indicator with a volatility based trailing line that gives you momentum crossovers and confirmations. Input Parameters are: RSI Period : Default setting is 14 SF , smoothing factor : Default setting is 5 QQE coefficient : Default setting is 4.236 , one of most used percentage ratios based on the Fibonacci sequence OversoldLevel : Default setting is 30. If this is set to 30, overbought level is automatically set to 100-30 = 70 on the chart Plots two lines: – QQE , Yellow line – Trail , Cyan line Coded by…
-
Trade From Chart Free Indicator
The Trade From Chart indicator for NT8 allows placing orders with a keyboard + mouse combination on a NinjaTrader chart, without having to use NinjaTrader’s fiddly right-click menu. Select from indicator properties what key you want to use plus mouse click You can select from the left side of the keyboard or the right side of the keyboard the Shift or Alt key plus mouse click You can find the author of this code here https://github.com/DominikBritz