
Cumulative Delta CVOV3
The PropTraderz Cumulative Delta CVOV3 Indicator brings together three powerful forms of volume analysis—OBV, CVD, and PVT—into a single dynamic tool.
It translates raw volume data into a clear, actionable view of market participation, showing when aggressive buyers or sellers are dominating, and when pressure begins to shift.
Designed for NinjaTrader 8, this indicator was inspired by cumulative delta methodologies originally developed by Igor Zeierman, and re-engineered by PropTraderz to offer flexible visualization, smarter normalization, and full bar-color integration.
Create a free account or login to unlock this download.
⚙️ What It Does
At its core, the CVO measures how volume flows through price movement. It helps traders understand who is in control of the market—buyers or sellers—and when that control starts to fade.
The indicator calculates cumulative “delta” across three selectable modes:
OBV (On-Balance Volume) — Adds volume on up-closes, subtracts it on down-closes.
A classic momentum confirmation tool, now integrated into a smoother oscillator form.
CVD (Cumulative Volume Delta) — Measures the difference between buying and selling volume using wick/body weighting per bar.
Perfect for identifying subtle shifts in order flow and aggressive trader activity.
PVT (Price Volume Trend) — Tracks volume multiplied by percentage price change.
Great for detecting early accumulation or distribution zones before price breaks.
These volume-based signals are then smoothed using two EMAs (short and long) to generate an oscillator—showing clear momentum turns, divergences, and exhaustion points.
📊 How It Works
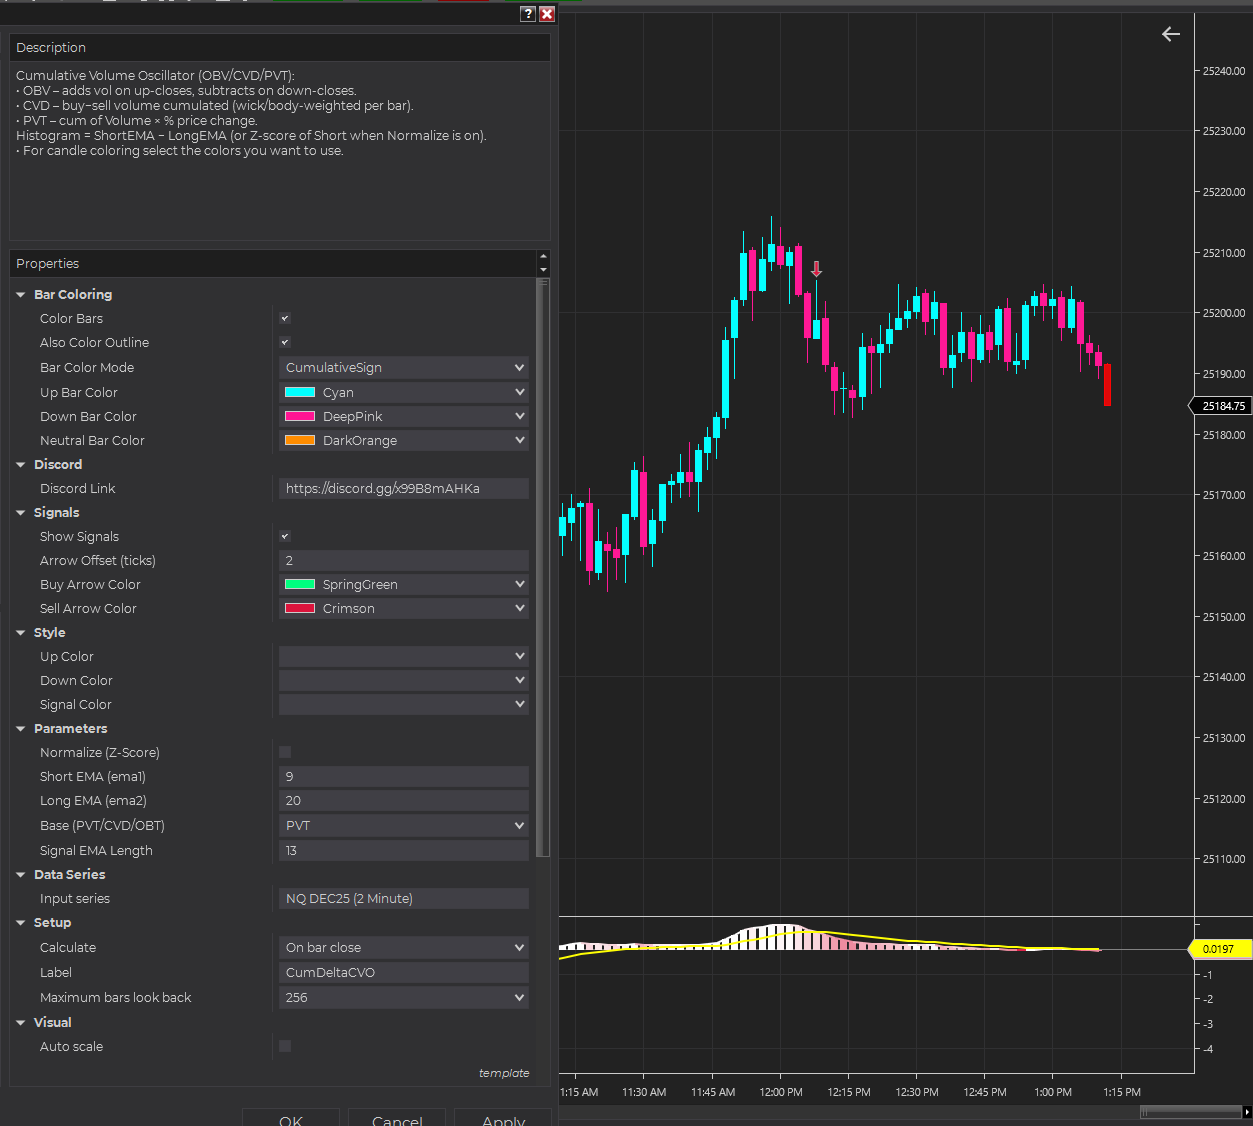
Choose a Base Mode — OBV, CVD, or PVT.
Define Your EMAs — The short EMA tracks immediate pressure, while the long EMA represents underlying trend strength.
Watch the Histogram and Signal Line — When the short EMA crosses above the long EMA, momentum turns bullish; a cross below signals bearish control.
(Optional) Normalize with Z-Score — Switch to statistical normalization mode to view deviations relative to mean volatility.
The result is a responsive, zero-centered oscillator that clearly highlights strength, weakness, and trend reversals long before traditional indicators catch them.
Our custom build extends the standard CVD approach with enhanced clarity and customization:
✅ Triple-Base Selection — OBV, CVD, or PVT modes
✅ Z-Score Normalization — Convert volume flow into standardized statistical readings
✅ Gradient Histogram & Line — Visually intuitive color transitions for momentum strength
✅ Signal Line Overlay — Yellow smoothing EMA to confirm oscillation bias
✅ Dynamic Candle Coloring — Paint candles by:
Cumulative Sign (overall bias)
Cumulative Slope (change vs prior bar)
Per-Bar Delta (instant order-flow impulse)
✅ Independent Outline & Body Color Controls

Everything is optimized for NinjaTrader performance—lightweight, clean, and designed to integrate seamlessly with your PropTraderz toolkit.
🧠 How to Read It
-
Rising CVO + Green Histogram: buyers absorbing selling pressure → strength building.
-
Falling CVO + Red Histogram: sellers dominating → pressure exhaustion forming.
-
Divergences: when price makes new highs/lows but CVO doesn’t, a reversal is near.
-
Z-Score > 2 or < -2: signals statistically extreme buying or selling activity.
-
Bar Colors: real-time volume aggression feedback directly on price candles.
⚙️ Note on Delta Source
This indicator uses bar-based volume calculations rather than tick-by-tick bid/ask data.
The “CVD” (Cumulative Volume Delta) mode approximates buying and selling pressure by analyzing candle structure — body size, wicks, and direction — to estimate how much volume occurred on the bid vs. the ask.
Because it operates from standard bar volume, it works with any data feed and is lightweight for real-time charts.
However, it does not use true order-flow delta, which requires tick-level data and bid/ask volume from specialized feeds such as Rithmic or CQG.
In short:
OBV and PVT measure volume direction and price momentum,
while CVD models relative buying and selling pressure using the same bar data.
You May Also Like

Master Candle Signal

HFTRsiScalp – High-Frequency Trading Scalping
