HFTRsiScalp – High-Frequency Trading Scalping
The HFTRsiScalp – High-Frequency Trading Scalping indicator is designed to help identify potential long and short setups with a combination of RSI signals, swing highs/lows, and price action analysis.
Send download link to:HFTRsiScalp

How HFTRsiScalp – High-Frequency Trading Scalping Works
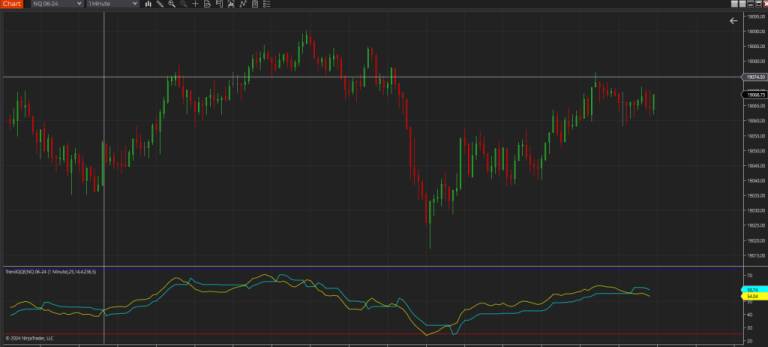
The indicator automatically detects potential double-bottom (bullish) and double-top (bearish) formations using swing high/low data and the ATR (Average True Range) for volatility assessment.
- For Long Entries:
- The indicator looks for two consecutive swing lows, where the second low is lower than the first.
- If the price breaks above the identified break level, a long entry signal is generated.
- The indicator then places a visual marker labeled “2B” and draws an entry line.
- For Short Entries:
- The indicator looks for two consecutive swing highs, where the second high is higher than the first.
- If the price breaks below the identified break level, a short entry signal is generated.
-
A “2B” label appears, along with a corresponding entry line.
The indicator is set to calculate on every tick (using Calculate.OnEachTick), so it updates its signals intra-bar. This means that during an active bar the signals may change until the bar closes, which some traders might refer to as “repainting.” However, once a bar is complete, the signals for that bar are fixed and won’t change retroactively.
So, in short:Intra-bar (current bar): Signals may update (which looks like repainting).
Historical bars: Signals remain fixed once the bar is closed.
If you need a non-repainting version for live trading, you’d typically calculate on bar close (using Calculate.OnBarClose) so that the signals don’t change mid-bar.
2. HFTRSI Strategy (Momentum Confirmation Using RSI)
In addition to pattern detection, the indicator also employs RSI confirmation for additional trade validity.
- Bullish RSI Signal:
- If RSI crosses above 30 and two consecutive green candles appear, it confirms bullish momentum.
- A buy signal is triggered, and a support line is drawn.
- Bearish RSI Signal:
- If RSI crosses below 70 and two consecutive red candles appear, it confirms bearish momentum.
- A sell signal is triggered, and a resistance line is drawn.
If you find this tool useful, consider supporting us by buying us a coffee! ☕ Buy Me a Coffee