KNN Supertrend Horizon
The KNN Supertrend Horizon indicator is a machine learning trading indicator built to help traders identify trend direction, trend strength, and high-interest rejection areas on the chart. By combining K-Nearest Neighbors (KNN) classification with Supertrend logic, it transforms traditional trend-following analysis into a smarter, more adaptive trading strategy. The result is a clearer view of bullish and bearish market conditions, stronger confirmation for trend trades, and visual rejection signals that can help traders time entries, exits, and risk management more effectively.
How to Trade the KNN Supertrend Horizon Indicator
The KNN Supertrend Horizon indicator is designed to do more than a standard Supertrend. Instead of relying only on ATR-based trend shifts, it applies a machine learning model to evaluate whether the current market environment resembles past bullish or bearish conditions. This makes it useful for traders who want a trend indicator, machine learning indicator, and price action confirmation tool in one script.
At its core, the indicator helps traders stay aligned with the dominant move while also highlighting points where price may be rejecting a key trend level. This makes it suitable for trend-following strategies, pullback entries, and momentum confirmation.
Trend Direction and Market Bias
The main trend signal comes from the interaction between the KNN engine and the Supertrend baseline. The machine learning model studies RSI and ATR-related volatility across a historical search window, then classifies the most likely trend state based on similar past market behavior.
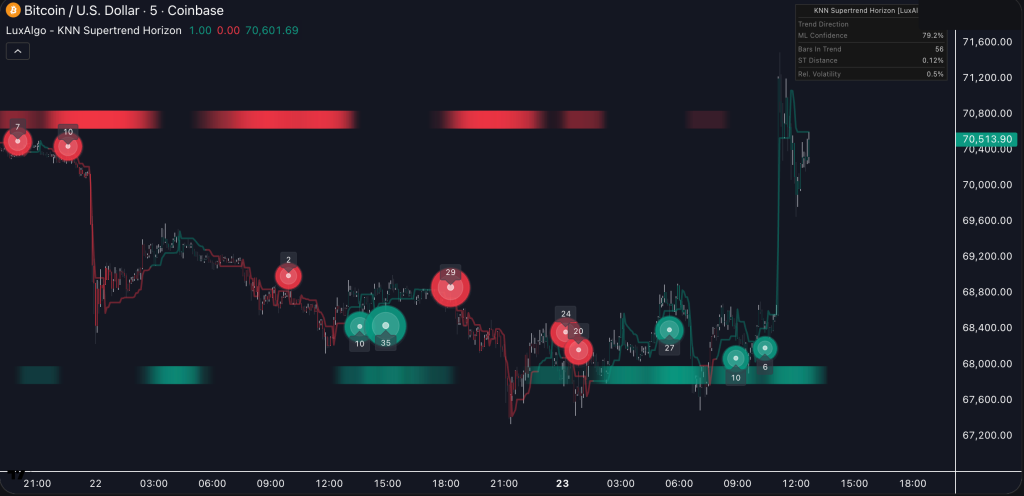
When the machine learning output agrees with the Supertrend direction, the indicator displays a colored horizon on the chart. This gives traders a fast way to read bias:
- A bullish horizon suggests buyers are in control and price is trading in a higher-probability uptrend environment.
- A bearish horizon suggests sellers are in control and price is trading in a higher-probability downtrend environment.
- A weaker or less convincing visual state can suggest trend fatigue, indecision, or a market entering consolidation.
This structure makes the tool useful as both a trend confirmation indicator and a market regime filter.
3D Rejection Orbs for Entry and Exit Clues
One of the standout features of this trading indicator is the 3D Rejection Orbs, which appear when price reacts sharply around the Supertrend level and leaves behind a meaningful wick. These signals are designed to highlight moments where the market appears to reject continuation in one direction and respond strongly at the trend baseline.
- The size of each orb changes dynamically based on relative volume.
- A label attached to the orb displays the exact volume of the rejection candle.
- These signals can help traders spot potential pullback entries, defensive exits, or local exhaustion areas.
In bullish conditions, traders may interpret rejection orbs near support as signs that buyers are stepping back in. In bearish conditions, rejection orbs near resistance can suggest renewed selling pressure. While these signals are not meant to be used in isolation, they can be powerful when combined with broader trend direction and market structure.