Volume Profile Explained: POC, Value Area, HVN and LVN for Futures Traders
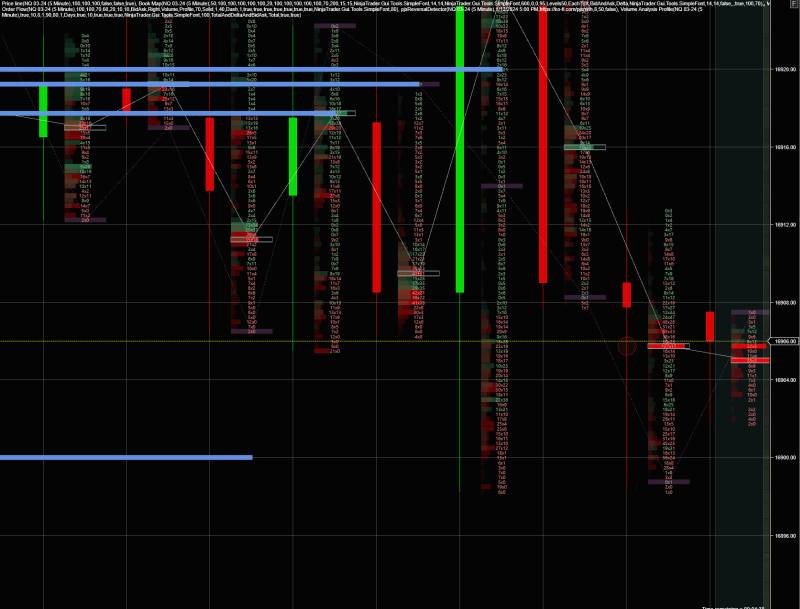
A normal volume bar shows how much traded in a period of time. A volume profile shows how much traded at each price. It reveals where the market spent time and accepted value, and where it moved quickly.
Key terms
| Term | Meaning |
|---|---|
| POC (point of control) | The price with the most volume |
| Value area (VA) | The range where about 70% of the volume traded |
| VAH / VAL | Value area high and low |
| HVN | High-volume node: accepted price, tends to slow price down |
| LVN | Low-volume node: rejected price, price tends to move through quickly |
| TPO / Market Profile | A similar profile built from time spent at each price instead of volume |
How traders use it
- Prior day levels: yesterday’s POC, VAH and VAL are common reaction levels today.
- Open inside vs outside value: opening outside yesterday’s value area and failing to get back in often leads to a trend day; opening inside often means rotation.
- LVN targets: price tends to travel quickly through low-volume areas to the next high-volume node.
- The 80% rule (market profile): if price opens outside value and re-enters it, it often travels to the other side of the value area.
Common mistakes
- Using too many profiles on one chart.
- Treating every POC as a hard level.
- Ignoring the session setting (Globex vs RTH), which changes the profile.
Free Volume Profile & Market Profile indicators to download
FAQ
What is POC in trading?
The point of control: the price where the most volume traded in the profile period.
Volume profile or market profile?
Volume profile uses volume at each price; market profile (TPO) uses time spent at each price. They often show similar levels.

More in the Indicator Library: VWAP & Anchored VWAP · Cumulative Delta & Order Flow. Test any setting in a simulator and track results in our free Trade Journal.
Educational content only. Indicators describe past price and volume; none predicts the future. Not financial advice.

I mainly trade NQ futures, mostly micros, on prop firm accounts. I actually started with options, and I still trade some stocks and options on the side. PropTraderz started as my own notes on my prop firm journey and the rules I had to learn, and grew into free tools, indicators and guides for other traders. I was helped a lot when I started, so this is my way of giving back. If something here helps you, pass it on and help the next trader too.