
NinjaTrader 8 Harmonic Pattern indicator
Harmonic Patterns

This NinjaTrader 8 harmonic pattern indicator automatically identifies eight popular XABCD harmonic patterns and displays them directly on your trading chart. It also includes hidden plots that can be used for strategy automation, signal processing and historical backtesting.
Harmonic patterns use Fibonacci retracements and extensions to identify areas where price may complete a structured move. These completion zones are often monitored for possible reversals, continuations or changes in market direction.
Manually identifying harmonic patterns can be difficult because each formation requires several swing points and specific Fibonacci relationships. This indicator automates the detection process and allows traders to configure the pattern ratios and visualization settings.
NinjaTrader 8 Harmonic Pattern Indicator Features
The NinjaTrader 8 harmonic pattern indicator scans market swings and detects eight different harmonic formations.
- Automatic XABCD pattern detection
- Eight configurable harmonic patterns
- Bullish and bearish pattern identification
- Adjustable Fibonacci tolerances
- Pattern update and cancellation signals
- Hidden plots for NinjaTrader strategies
- Support for automated strategy development
- Historical strategy backtesting
- Configurable chart visualization
- Swing reversal confirmation signals
Visit the PropTraderz Indicator Radar to vote for indicators and compare other trading tools. You can also browse more free trading indicators available on PropTraderz.
What Are Harmonic Patterns?
Harmonic patterns are geometric price formations based on a sequence of market swings and Fibonacci relationships.
Most harmonic structures are represented by five points:
- X
- A
- B
- C
- D
These points form several connected price legs:
- XA
- AB
- BC
- CD
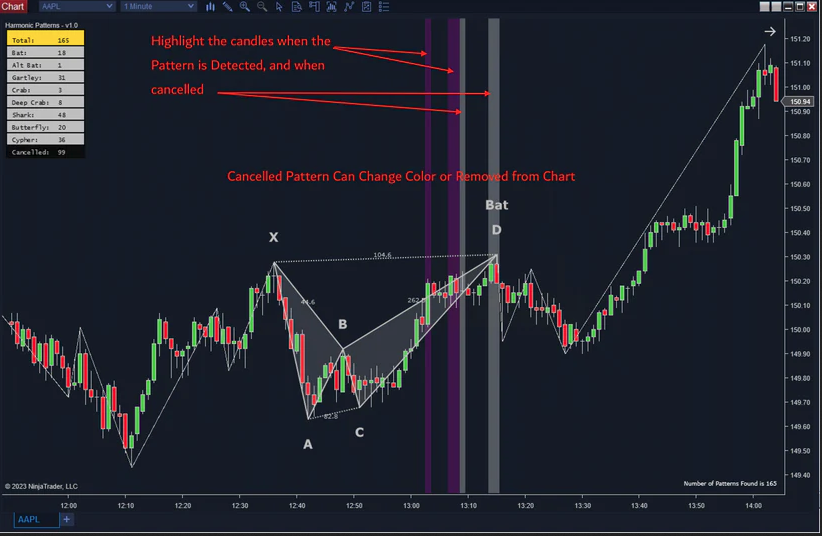
Each pattern uses different Fibonacci retracement and extension requirements. When the final D point reaches the expected completion area, traders may begin monitoring price for confirmation of a possible reversal.
The projected completion area is commonly called the Potential Reversal Zone, or PRZ.
Why Use an Automatic Harmonic Pattern Indicator?
Manually drawing harmonic patterns requires accurate swing identification, Fibonacci measurements and continuous chart monitoring.
A NinjaTrader 8 harmonic pattern indicator can simplify this process by automatically:
- Detecting the relevant market swings
- Measuring Fibonacci relationships
- Comparing ratios with configured pattern rules
- Drawing completed or developing patterns
- Updating patterns when market structure changes
- Cancelling invalid formations
- Providing numerical outputs for automated strategies
Automatic detection does not guarantee that every identified pattern will produce a successful reversal. It reduces the manual work involved in locating and monitoring possible harmonic setups.
NinjaTrader 8 harmonic pattern indicator have Harmonic Patterns Detected
The indicator identifies the following eight XABCD harmonic patterns:
- Bat
- Alternative Bat
- Gartley
- Crab
- Deep Crab
- Shark
- Butterfly
- Cypher
The Fibonacci configuration of each formation can be adjusted from the indicator settings. This allows traders to use stricter or more flexible pattern tolerances.
Bat Harmonic Pattern
The Bat pattern is an XABCD harmonic formation commonly associated with a deep retracement of the initial XA movement.
Its most recognizable characteristic is the completion of the D point near the 88.6% retracement of the XA leg.
A typical Bat structure may include:
- Point B retracing approximately 38.2% to 50% of XA
- Point C retracing a portion of AB
- Point D completing near the 88.6% retracement of XA
- A BC projection contributing to the Potential Reversal Zone
The pattern can appear as either a bullish or bearish formation, depending on the direction of the initial XA leg.
Alternative Bat Pattern
The Alternative Bat is a variation of the traditional Bat formation.
It generally uses a deeper extension for the final CD leg and may complete beyond the original X point. The exact ratios depend on the selected pattern configuration and tolerance settings.
Like the standard Bat, the Alternative Bat can appear in bullish or bearish form.
Gartley Harmonic Pattern
The Gartley is one of the best-known harmonic patterns.
A classical Gartley formation typically includes:
- Point B near the 61.8% retracement of XA
- Point C retracing a portion of AB
- Point D completing near the 78.6% retracement of XA
- An AB=CD relationship contributing to the completion zone
The Gartley attempts to identify a retracement within a broader directional move. It may form as either a bullish or bearish pattern.
Crab Harmonic Pattern
The Crab is an extension-based harmonic formation that usually completes beyond the original X point.
One of its defining characteristics is a D point near the 161.8% extension of XA.
The Crab may include:
- A moderate retracement at point B
- A variable retracement at point C
- A substantial extension of the BC or XA leg
- A narrow Potential Reversal Zone near point D
Because the final leg may extend sharply, traders should wait for confirmation rather than entering solely because the projected D level has been reached.
Deep Crab Harmonic Pattern
The Deep Crab is a variation of the standard Crab pattern.
Its B point normally makes a deeper retracement of XA, commonly near the 88.6% level. The D point may still complete around the 161.8% extension of XA.
The Deep Crab can form in both bullish and bearish market structures.
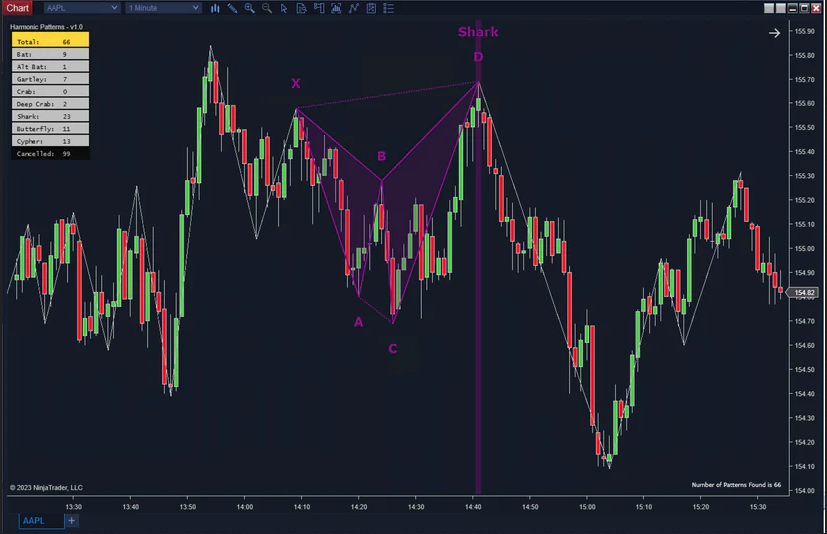
Shark Harmonic Pattern
The Shark pattern uses a different swing structure from the traditional XABCD formations.
It is often described using the points O, X, A, B and C, although some indicators may map the structure to standard XABCD labels.
The Shark typically contains:
- A strong extension beyond a previous swing
- A deep retracement or expansion leg
- A completion area based on several Fibonacci projections
- A possible transition into another harmonic structure
Because the Shark can develop quickly, its detection and cancellation signals may change as the final swing continues to move.
 Butterfly Harmonic Pattern
The Butterfly is an extension pattern in which the final D point normally completes beyond the original X point.
A classical Butterfly often includes:
- Point B near the 78.6% retracement of XA
- Point C retracing part of AB
- Point D completing near a 127.2% or 161.8% extension of XA
- Additional BC projections inside the Potential Reversal Zone
The Butterfly may identify a potential bullish reversal after a declining structure or a bearish reversal after an advancing structure.
Cypher Harmonic Pattern
The Cypher is a harmonic formation that uses a distinctive extension of the XA leg and a relatively shallow completion retracement.
A typical Cypher pattern may include:
- Point B retracing part of XA
- Point C extending beyond point A
- Point D retracing approximately 78.6% of the XC movement
- A defined Potential Reversal Zone near point D
The Cypher can appear in bullish or bearish form and may be used in trending or rotational market conditions.
Hidden Plots for Strategy Automation
The NinjaTrader 8 harmonic pattern indicator provides several hidden plots that can be accessed from NinjaScript strategies.
These plots allow traders and developers to create automated rules based on pattern detection, pattern updates, cancellations and swing changes.
PatternDetectSignal
- -1: a bearish pattern has been detected
- -2: an existing bearish pattern has been updated
- 1: a bullish pattern has been detected
- 2: an existing bullish pattern has been updated
PatternType
The PatternType plot returns a numerical value from 1 to 8.
- 1: Bat
- 2: Alternative Bat
- 3: Gartley
- 4: Crab
- 5: Deep Crab
- 6: Shark
- 7: Butterfly
- 8: Cypher
PatternCancelSignal
- -1: a bearish pattern has been cancelled
- 1: a bullish pattern has been cancelled
A pattern may be cancelled when the final point moves beyond the permitted Fibonacci limits or the underlying swing structure becomes invalid.
SwingSwitch
- 1: late confirmation of a change from a bearish swing to a bullish swing
- -1: late confirmation of a change from a bullish swing to a bearish swing
SwingSwitch may be used as an additional confirmation condition in an automated or discretionary strategy.
How to Use the NinjaTrader 8 Harmonic Pattern Indicator
The NinjaTrader 8 harmonic pattern indicator should be used as an analytical tool rather than as an automatic entry system.
A practical workflow may include the following steps:
- Identify the broader market trend and structure.
- Allow the indicator to detect a developing harmonic pattern.
- Wait for price to approach the projected D point or Potential Reversal Zone.
- Monitor whether the pattern remains valid or receives a cancellation signal.
- Look for additional price-action or order-flow confirmation.
- Define the entry, stop-loss and profit target before placing a trade.
Pattern Confirmation and Confluence
A harmonic pattern should not be traded solely because it appears on the chart.
Possible confirmation tools include:
- Support and resistance
- Previous-session highs and lows
- Volume profile levels
- VWAP
- Order flow or footprint charts
- Momentum divergence
- Candlestick rejection
- Trend structure
- Liquidity sweeps
The strongest setups generally occur when the harmonic completion zone aligns with another meaningful technical area.
Pattern Detection and Cancellation
Harmonic formations are based on developing swing points. The final point can continue moving after the pattern is initially detected.
For this reason, a pattern may:
- Be detected before the final swing is complete
- Update as the D point changes
- Move to a slightly different completion price
- Be cancelled if the configured limits are exceeded
Important: a detected pattern is not necessarily a confirmed market reversal. Always wait for your own entry conditions and risk parameters.
Using Harmonic Patterns in Automated Strategies
The hidden plots can be accessed from a NinjaTrader strategy to create automated conditions.
For example, a strategy could require:
- A bullish PatternDetectSignal
- A specific PatternType
- Price trading inside the completion zone
- A bullish SwingSwitch confirmation
- No active PatternCancelSignal
- A predefined stop-loss and profit target
A bearish strategy could use the opposite signal values.
Backtesting can help determine how a particular pattern configuration performed historically, but historical results do not guarantee future performance.
Strategy Backtesting Considerations
When backtesting harmonic patterns, consider:
- The instrument being tested
- The bar type and timeframe
- The pattern tolerance settings
- Whether the strategy enters on initial detection or later confirmation
- Pattern updates and cancellations
- Commissions and slippage
- Stop-loss placement
- Profit-target methodology
- Out-of-sample testing
A strategy that enters immediately when a pattern is first detected may produce different results from one that waits for a SwingSwitch or additional confirmation.
How to Install the NinjaTrader 8 Harmonic Pattern Indicator
- Download the indicator ZIP file.
- Open NinjaTrader 8.
- Select Tools.
- Choose Import.
- Select NinjaScript Add-On.
- Locate and import the downloaded ZIP file.
- Open a chart.
- Right-click the chart and select Indicators.
- Add the harmonic pattern indicator.
- Configure the pattern and visualization settings.
The indicator is designed for the official NinjaTrader trading platform.
NinjaTrader 8 Harmonic Pattern Indicator Settings
The available settings may include:
- Individual pattern enable or disable controls
- Fibonacci ratio tolerances
- Swing detection sensitivity
- Pattern colors
- Line thickness
- Text labels
- Bullish and bearish pattern visibility
- Completed or developing pattern display
- Historical pattern visibility
Start with the default configuration and adjust one setting at a time. Excessively broad Fibonacci tolerances may detect more patterns but can also increase the number of low-quality formations.
Benefits of Automated Harmonic Pattern Detection
The NinjaTrader 8 harmonic pattern indicator can reduce the time required to scan charts manually.
Potential benefits include:
- Consistent Fibonacci measurements
- Faster identification of developing structures
- Reduced manual drawing
- Objective pattern classification
- Automated signal access
- Historical performance testing
- Monitoring multiple markets or timeframes
The primary advantage is consistency. The same ratio rules are applied to every detected formation.
Limitations of Harmonic Pattern Indicators
No harmonic pattern indicator can guarantee profitable trades.
Important limitations include:
- Patterns may update after initial detection
- Patterns may be cancelled
- Different swing settings produce different results
- Some patterns complete without reversing
- Fibonacci ratios require configurable tolerances
- Market volatility can invalidate the setup
- Historical performance may not continue in future markets
Use the indicator together with market context, confirmation and predefined risk management.
Final Thoughts
This NinjaTrader 8 harmonic pattern indicator provides automatic detection of eight popular harmonic formations: Bat, Alternative Bat, Gartley, Crab, Deep Crab, Shark, Butterfly and Cypher.
It also includes hidden numerical plots for pattern detection, pattern updates, cancellation events, pattern classification and swing confirmation.
These outputs make the indicator suitable for discretionary chart analysis, NinjaScript strategy development and historical backtesting.
Harmonic patterns should not be treated as guaranteed reversal signals. Wait for confirmation, define your invalidation point and test any automated strategy thoroughly before using real capital.
Visit the Indicator Radar to vote for indicators and discover additional tools. You can also browse more free NinjaTrader indicators here.
Frequently Asked Questions
What patterns does the indicator detect?
It detects Bat, Alternative Bat, Gartley, Crab, Deep Crab, Shark, Butterfly and Cypher patterns.
Does the indicator detect bullish and bearish patterns?
Yes. It identifies both bullish and bearish harmonic formations.
Can harmonic patterns be cancelled after detection?
Yes. A detected pattern may update or be cancelled if the final swing exceeds the configured Fibonacci limits.
Can I use the indicator in an automated NinjaTrader strategy?
Yes. The indicator provides hidden plots for pattern detection, pattern type, cancellation signals and swing-direction changes.
Can the indicator be backtested?
Yes. Its hidden plots can be accessed from a NinjaScript strategy and used in historical backtesting.
Does a detected harmonic pattern guarantee a reversal?
No. A detected formation identifies a potential setup, not a guaranteed market reversal.
What is PatternDetectSignal?
PatternDetectSignal indicates whether a bullish or bearish pattern has been detected or updated.
What is PatternCancelSignal?
PatternCancelSignal indicates that a previously detected bullish or bearish pattern has become invalid.
What does SwingSwitch indicate?
SwingSwitch provides a delayed confirmation that the detected market swing has changed direction.
Should I use additional confirmation?
Yes. Consider combining harmonic patterns with support and resistance, volume, order flow, market structure or another independent confirmation method.
Risk Disclosure
Trading futures, forex, stocks and other financial instruments involves substantial risk and may not be suitable for every trader.
This indicator is provided for informational and educational purposes only. It does not provide investment advice, financial advice or guaranteed trading signals.
Past performance and historical backtesting do not guarantee future results. Test all indicators and automated strategies in a simulated environment before using real capital.
More premium indicators for Ninjatrader can be found HERE