RSI Scalper
RSI Scalper Key Components
Send download link to:
RSI Scalper
- Fast & Slow RSI
- Fast RSI (default length of 4) is sensitive to quick market shifts.
- Slow RSI (default length of 9) smooths out noise.
- Together, they help identify immediate momentum changes while still referencing a more stable view of the trend.
- Overbought/Oversold Levels
- Overbought: Default 68
- Oversold: Default 42
- These thresholds trigger “firstLong” or “firstShort” conditions, allowing the indicator to anticipate potential reversals.
- LSMA (Least Squares Moving Average)
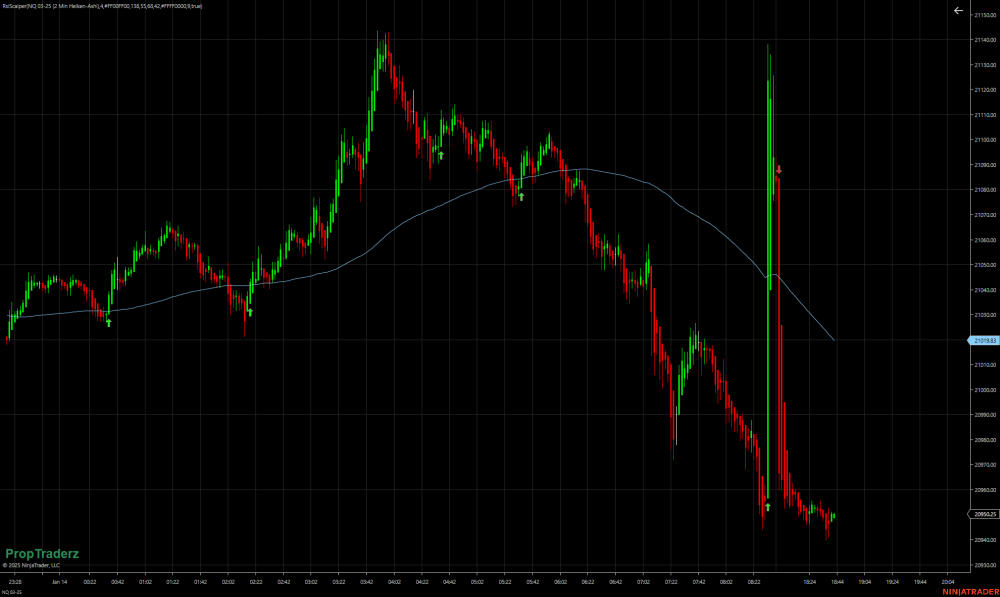
- An internal custom indicator calculates the slope of the LSMA line (default 40-period, offset 10. I use 138/55).
- Uptrend is detected if the LSMA slope is positive.
- Downtrend is detected if the LSMA slope is negative.
- Signals
- Arrows appear on the chart to indicate potential entries.
- Long Signals are drawn when the Fast RSI crosses above the Overbought level (68) and the Slow RSI was previously below the Oversold threshold—indicating a strong upward shift.
- Short Signals are drawn when the Fast RSI crosses below the Oversold level (42) after the Slow RSI was above the Overbought threshold—indicating a downward move.
- LSMA Filter (Optional)
- When enabled, the indicator checks LSMA slope to see if it’s trending up or down.
- Long signals only appear if the market is in an uptrend.
- Short signals only appear if the market is in a downtrend.
- This helps filter out signals that occur during counter-trend conditions, improving potential trade quality.
How It Works Step by Step
- Initialize
- On each new bar, the indicator calculates the Fast RSI and Slow RSI values.
- It tracks whether the Slow RSI was previously above Overbought or below Oversold—this sets up “firstShort” or “firstLong.”
- Check RSI Crosses
- If the Fast RSI crosses below the Oversold level (42) and “firstShort” is true, it signals a potential short setup.
- Conversely, if the Fast RSI crosses above the Overbought level (68) and “firstLong” is true, a potential long setup is triggered.
- Apply LSMA Filter (If Enabled)
- The slope of the LSMA is evaluated: if slope > 0, it’s an uptrend; if slope < 0, a downtrend.
- The indicator only draws an ArrowUp for long signals if it’s an uptrend. Similarly, it only draws an ArrowDown for short signals if it’s a downtrend.
- Plot & Arrows
- An LSMA line is plotted in the price panel .
- An arrow is drawn below a bar for a long signal, or above a bar for a short signal, colored according to your chosen settings (default: Lime for Long, Red for Short).
- Good length and offset would be 138 with an 55 offset(this can be customized by user choice)
Why It Matters
- Quick Scalps: By focusing on short RSI lengths, you capture rapid price fluctuations.
- Less Noise: The Slow RSI plus the LSMA filter helps confirm whether the short-term signal aligns with a broader move.
- Customizable: Adjust RSI lengths, Overbought/Oversold levels, and LSMA parameters to suit different markets or timeframes.
- Visual Cues: Arrows make spotting potential trades easier, while color-coded signals offer instant clarity on which direction to consider.