DTR vs ATR – The One-Line Volatility
📈 DTR vs ATR – The One-Line Volatility
What is it?
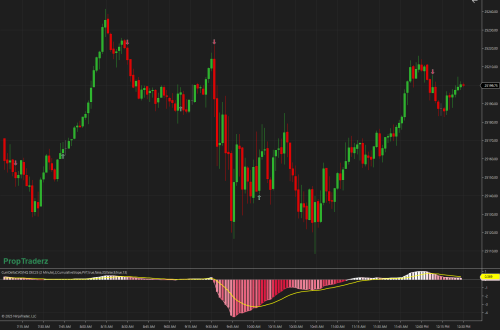
DTR vs ATR– The One-Line Volatilit is a simple yet powerful indicator developed by PropTraderz, now available on NinjaTrader 8, originally inspired by @Ripster in TradingView.
This tool overlays a clean, color-coded label on your chart that compares:
IMPORTANT : LOAD AT LEAST 14 DAYS OF DATA ON YOUR CHART
-
📊 DTR – Daily Trading Range: How far price has actually moved so far today.
-
🧮 ATR – Average True Range: How far the instrument usually moves in a day, averaged over the last 14 sessions (or your preferred lookback).
Together, it gives you a live, percentage-based readout of how “normal” or “abnormal” today’s volatility is.
Create a free account or login to unlock this download.
How to read it:
Example label:
This means:
-
The market has already moved 776.25 points today.
-
It normally moves 694.51 points per day.
-
So today’s volatility is 112% of average — a high-range day.
Can read more about DTR vs ATR here
Color coding:
| % of ATR used today | Label Color | Meaning |
|---|---|---|
| ≤ 70% | 🟢 Green | Quiet day, low volatility |
| 70% – 89% | 🟡 Gold | Normal range |
| ≥ 90% | 🔴 Red | High volatility / potential exhaustion |
How traders use it:
✅ Reversal traders: When DTR > 100%, you’re in high-range territory. Look for signs of exhaustion or mean reversion.
✅ Breakout traders: When DTR is low (< 60%), range expansion is likely — watch for momentum setups.
✅ Risk managers: ATR helps size positions appropriately. On high-volatility days, widen stops or reduce size.
Why this matters:
Most traders overlook volatility. But knowing whether the market has moved half, all, or more than usual can instantly shift your bias, risk tolerance, and timing.
DTR vs ATR gives you that edge — visually, simply, and live.
Try it now:
If you’re using NinjaTrader 8, install the DTR_ATR indicator and overlay it on your intraday chart. No matter what you trade — futures, stocks, crypto — this tool gives you instant context with zero clutter.