-
MFI WAVE PRO
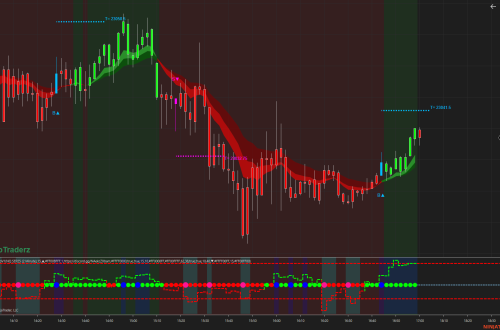
What Is MFI Wave Pro? MFI Wave Pro is designed to help traders identify potential market reversals and trend continuations by combining three key components: MFI (Money Flow Index) Signals:MFI is a momentum indicator that uses both price and volume to identify overbought or oversold conditions. In MFI WavePro, signals are generated when the MFI crosses specific thresholds (oversold and overbought levels). These signals are used to alert traders of potential buy or sell opportunities. EMA Trade Waves:Exponential Moving Averages (EMAs) are used to capture the market’s trend. By calculating and comparing multiple EMAs (fast, medium, and slow), MFI WavePro creates “trade waves” that visually represent bullish and bearish…
-
HFTRsiScalp – High-Frequency Trading Scalping
The HFTRsiScalp – High-Frequency Trading Scalping indicator is designed to help identify potential long and short setups with a combination of RSI signals, swing highs/lows, and price action analysis. How HFTRsiScalp – High-Frequency Trading Scalping Works The indicator automatically detects potential double-bottom (bullish) and double-top (bearish) formations using swing high/low data and the ATR (Average True Range) for volatility assessment. For Long Entries: The indicator looks for two consecutive swing lows, where the second low is lower than the first. If the price breaks above the identified break level, a long entry signal is generated. The indicator then places a visual marker labeled “2B” and draws an entry line.…
-
Second Entry V2_2 -PATS
Second Entry V2_2 PAT Detection The indicator tracks market structure and identifies when the market has made a two-legged move in either direction. It marks the second entry long (2EL) below price bars in an uptrend and the second entry short (2ES) above price bars in a downtrend. ✅ Customizable Entry Signals Leg Count Tracking: Identifies each leg of the move and only signals when the second leg forms. Customizable Risk Management: Set your target, stop-loss placement, and signal distance for optimized trade execution. Dynamic Signal Placement: Allows users to swap long and short entries for better visibility. ✅ Visual & Audio Alerts Arrows & Text Labels: Clearly displays second-entry…
-
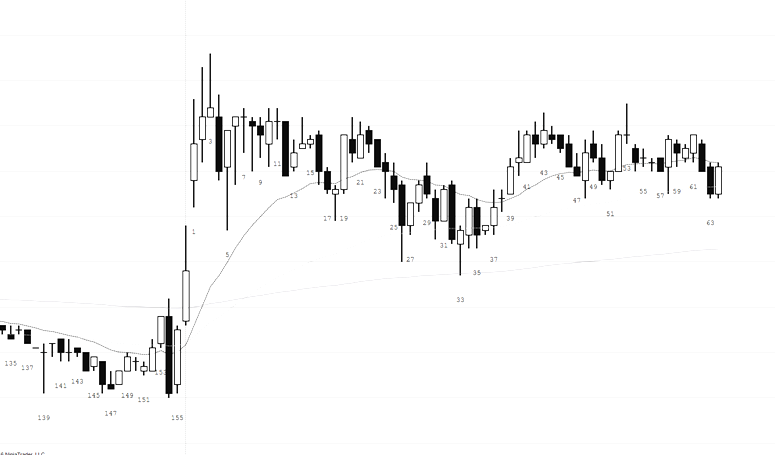
ZERO LAG TEMA
The Zero Lag TEMA Is an advanced variation of the standard TEMA (Triple Exponential Moving Average). It combines three exponential moving averages (EMAs) to produce a smooth yet responsive indicator designed specifically to reduce the lag typically found in conventional moving averages. By providing quicker signals, it allows traders to identify trends earlier and enter trades with improved timing. Calculation and Logic The standard TEMA calculation is: TEMA = 3 × (EMA₁ – EMA₂) + EMA₃ Zero Lag TEMA refines this approach by minimizing the inherent delay in data responsiveness, resulting in an indicator that closely tracks current price action without significant delays. How to Use the Zero-Lag TEMA Indicator…
-
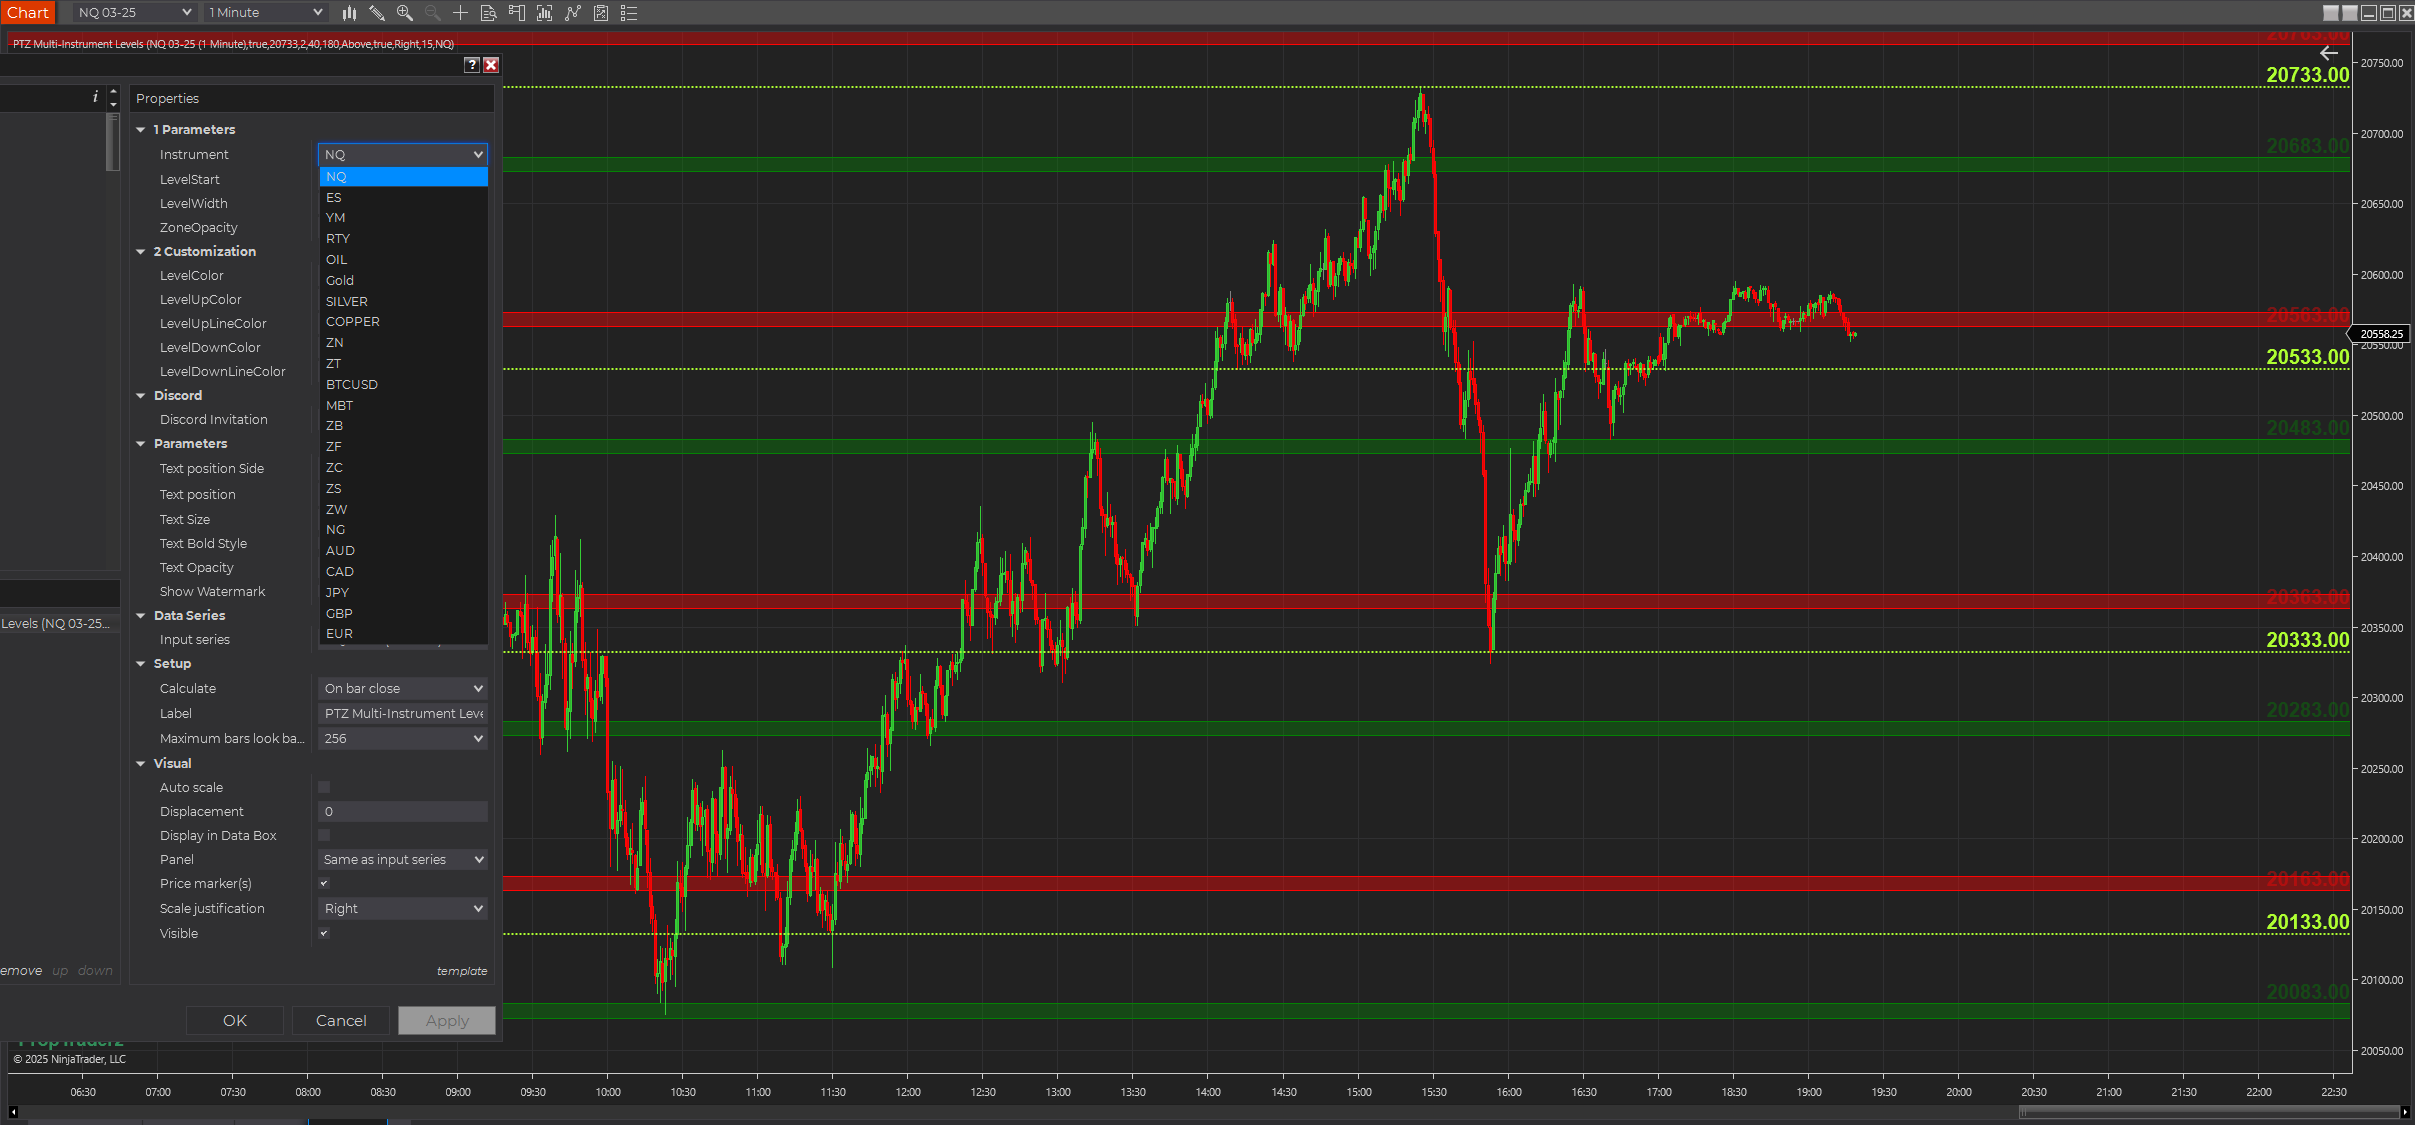
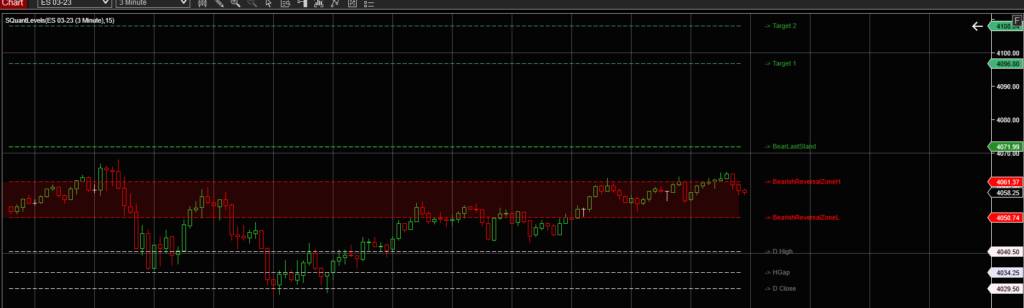
PTZ Multi-Instrument Levels
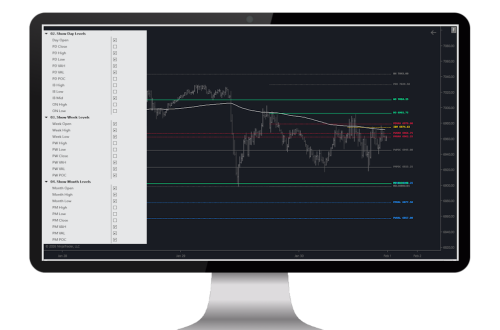
PTZ Multi-Instrument Levels Advanced Support & Resistance for NinjaTrader 8 This indicator helps you identify and visualize Advanced Support & Resistance for NinjaTrader 8. The PTZ Multi-Instrument Levels indicator is a great tool. Designed for traders who deal with multiple assets, this indicator automatically plots significant price levels, highlighting areas of interest with customizable zones. The PTZ Multi-Instrument Levels indicator is built to automatically detect and plot support and resistance levels for a wide range of instruments, including forex, futures, and crypto. It helps traders identify key levels where the price is likely to react, making it easier to spot potential trade setups. Key Features: ✅ Multi-Instrument Support –…
-
Scalp Trader MACD
The Scalp Trader MACD is an indicator designed for scalping. It also work for UniRenko, tick charts, and other bar types. Some UniRenko size are 32/80/160 Free Download Key Features: Dynamic No-Trade Zone Highlighting: Easily visualize out-of-session areas with customizable opacity, ensuring a clear distinction between active and inactive trading periods. Customizable Trade Filters: Refine your entries and exits using EMA and StepMA filters, designed to align with market trends and price action. Setup Flexibility: Configure stop-loss and profit target levels in ticks, giving you full control over your risk and reward. Monitor trade setups directly on the chart, including visual representations of stops and targets. Customizable signals,…
-
TrendScalperV1
Understand the Signals of TrendScalperV1 Indicator Dots: Buy Signal – Indicates upward momentum. Look for entries above this point. Dots: Sell Signal – Indicates downward momentum. Look for entries below this point. Arrow (Up): Buy Entry Point – Confirms a buy setup based on momentum and volatility. Arrow (Down): Sell Entry Point – Confirms a sell setup based on momentum and volatility. Dynamic Stop-Loss Management: Dashed Lines: Show ATR-based stop-loss levels for buy (aqua) and sell (red) trades. These adapt to market volatility to minimize risk. Follow the Visual Cues: Buy Signal Example: When a cyan dot appears, wait for the lime arrow to confirm entry. Sell…
-
RSI Scalper
RSI Scalper Key Components Fast & Slow RSI Fast RSI (default length of 4) is sensitive to quick market shifts. Slow RSI (default length of 9) smooths out noise. Together, they help identify immediate momentum changes while still referencing a more stable view of the trend. Overbought/Oversold Levels Overbought: Default 68 Oversold: Default 42 These thresholds trigger “firstLong” or “firstShort” conditions, allowing the indicator to anticipate potential reversals. LSMA (Least Squares Moving Average) An internal custom indicator calculates the slope of the LSMA line (default 40-period, offset 10. I use 138/55). Uptrend is detected if the LSMA slope is positive. Downtrend is detected if the LSMA slope is negative.…
-
RSIProZone
RSIProZone custom NinjaTrader 8 indicator enhances the standard RSI (Relative Strength Index) with optional ADX filtering—so you can quickly see when markets are trending and avoid sideways price action. With just a glance, you’ll spot buy/sell arrows when RSI crosses your chosen oversold/overbought thresholds. Plus, a subtle background color shift highlights extreme areas, so you know when to watch for potential reversals. How It Works RSIProZone Indicator RSI: A classic oscillator, defaulting to a 14-period calculation, with bullish (>50) or bearish (<50) color-coding. Signals: If RSI crosses above an oversold threshold (e.g., 25), you get a buy arrow; below an overbought threshold (e.g., 75), a sell arrow appears. Dots at…
-
MFIProZone
MFIProZone is a NinjaTrader 8 indicator that enhances the classic Money Flow Index with an optional ADX trend filter for clearer buy/sell signals and better avoidance of choppy markets. Key Features of MFI Refined MFIProZone Signals Above 50? MFIProZone plots a bullish color to help you spot positive momentum. Below 50? A bearish color indicates a potential downtrend. Overbought/Oversold Thresholds (e.g., 62/38) let you know when to watch for reversals. ADX Trend Filter ADX Above Threshold (often 25) means the market is trending. Signals only trigger in trending conditions, helping you avoid false trades in sideways markets. Clear Visuals & Alerts Background shading for extreme (90–100) or start (80–90)…