-
Golden Setup-Tony Rago
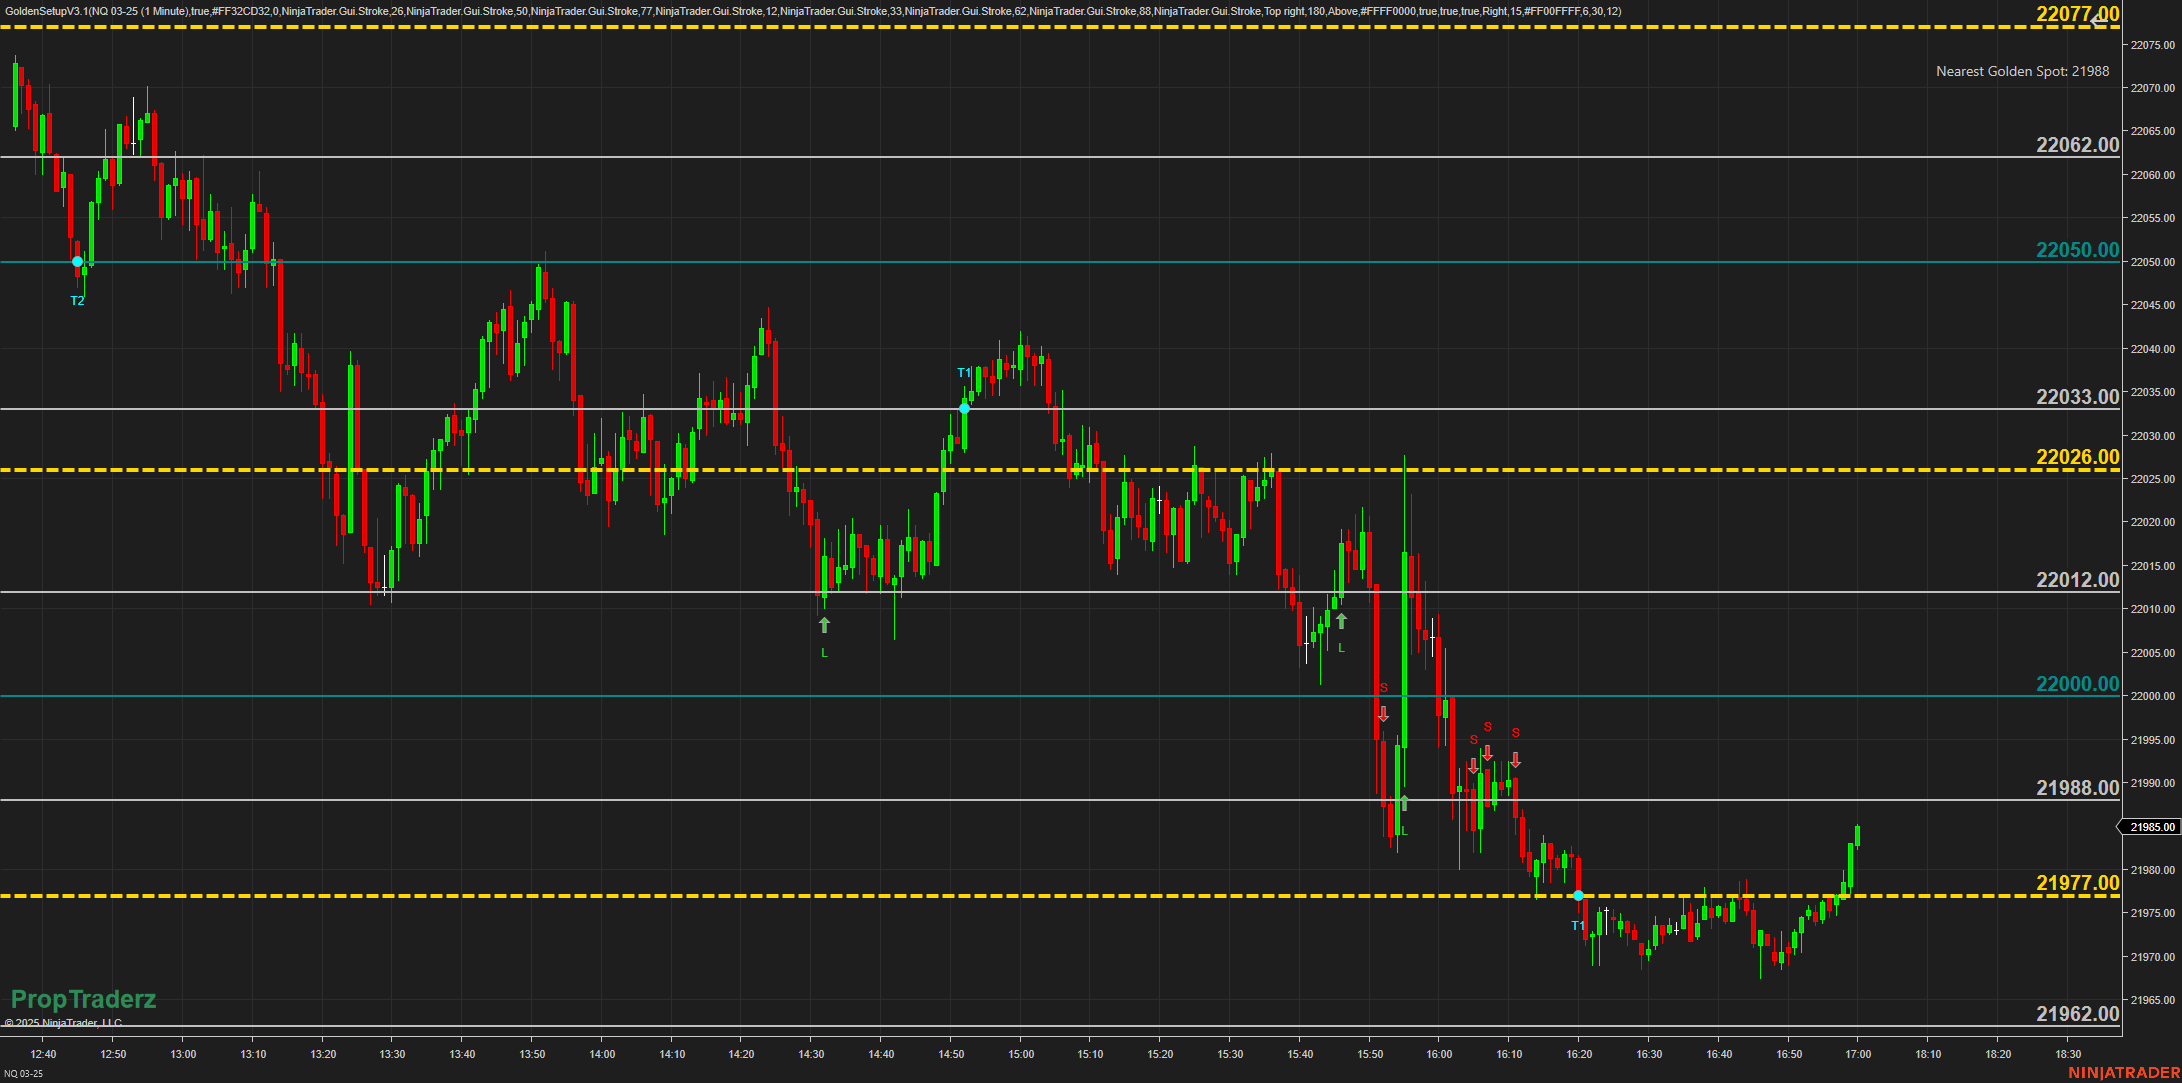
Mastering the Golden Setup Strategy NEW UPDATE The Golden Setup-Tony Rago Strategy, it’s developed by Tony Rago, and is a powerful method tailored for trading the E-mini NASDAQ Futures (NQ). This strategy focuses on price retracements within defined 100-handle blocks, offering traders structured and repeatable trade opportunities. Here’s an in-depth look at the Golden Setup and how it can be effectively implemented. Understanding the Golden Setup At its core, the Golden Setup revolves around the mechanical movement of the NQ within 100-point price ranges, referred to as “100-handle blocks.” These blocks are segmented into specific key levels, such as 26, 50,…
-
Twin Range Filter Free Indicator
The “Twin Range Filter Free indicator for Ninja Trader” is essentially a trend-following logic combined with adaptive volatility filters. The indicator starts with a given price series, usually the close of each bar (the source). All calculations are based on this input. Same indicator for TradingView can be found HERE Range Trading Explained HERE Computing the Smoothed Range : The indicator calculates two “smoothed ranges” based on two different periods (a fast period and a slow period) and then averages them. Fast Range: Uses a shorter period and a multiplier to measure recent volatility. Slow Range: Uses a longer period and a multiplier to gauge a more extended…
-
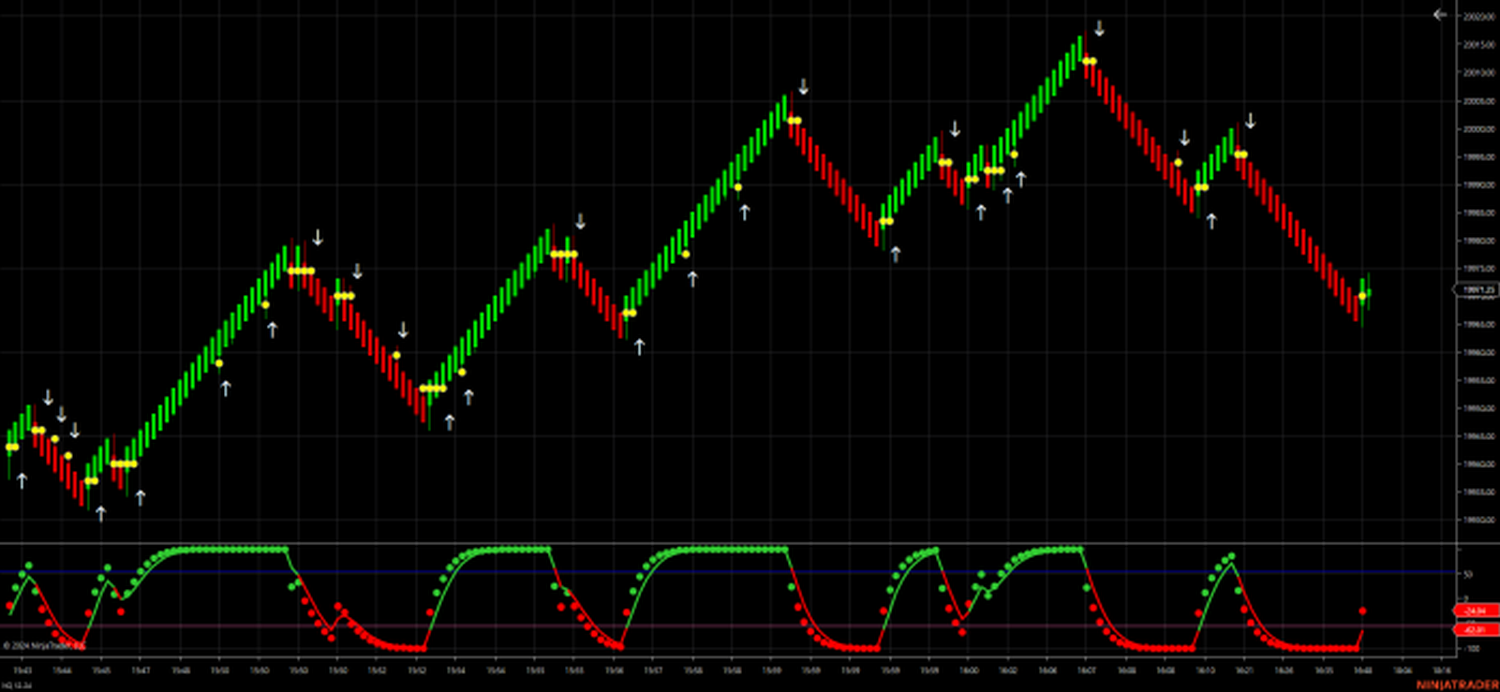
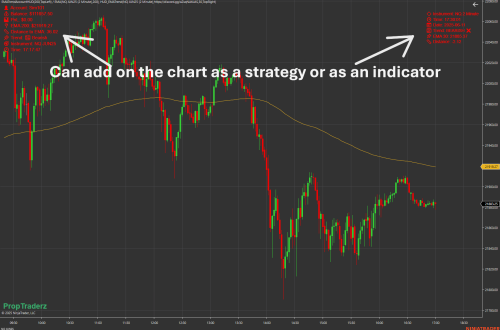
Trade Detector V2 Free
Functionality: Transaction Detection: TradeDetectorV2’s core function is to identify and display major transactions within a very short timeframe at specific price levels. It particularly focuses on limit orders where large volumes are traded at the same price. It classifies the magnitude of these transactions using three different volume thresholds (500, 1000, and 1500(customizable)). It is recommended when switching from Minis to Micros to increase the volume threshold Visual Signals: When a significant transaction is detected, the indicator visually marks this event on the chart with: Dots: Colored green for bullish transactions (buying) and purple for bearish ones (selling). Lines: These extend from the transaction price to the current median…
-
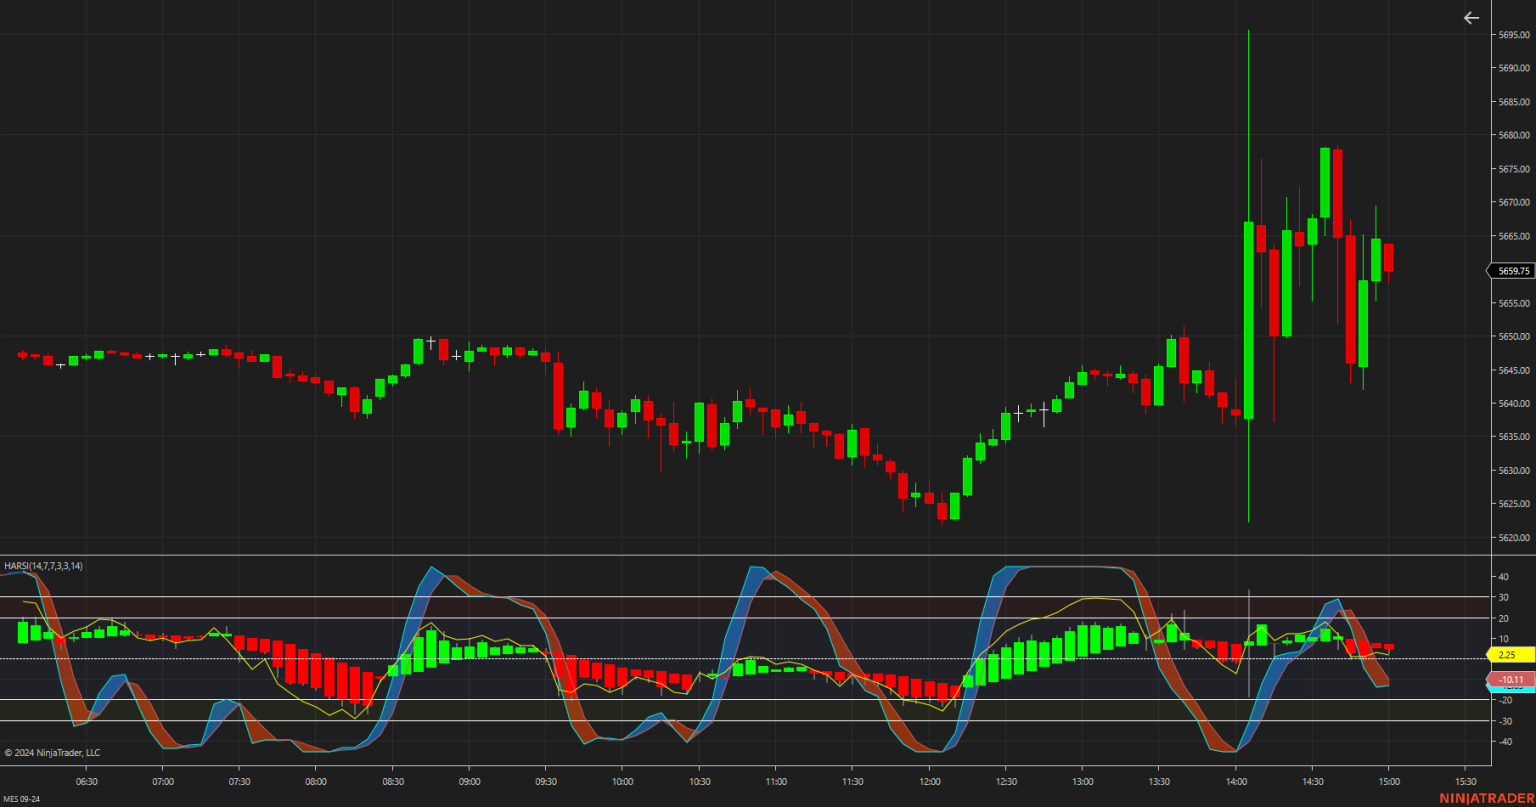
Heikin Ashi RSI Oscillator – HARSI Free
The **Heikin Ashi RSI Oscillator (HARSI)** combines two powerful indicators: **Heikin Ashi** candles and the **Relative Strength Index (RSI)**. It aims to smooth price data and highlight trends, while identifying overbought and oversold conditions. Key Features: 1. **Heikin Ashi Candles**: These candles smooth out price fluctuations, making trends easier to spot and filtering out noise from small price movements. 2. **RSI Calculation**: The RSI detects momentum and potential reversals by identifying overbought (when the asset is overvalued) or oversold (when the asset is undervalued) levels. 3. **Stochastic RSI Option**: The HARSI includes a stochastic version of the RSI, which provides further confirmation for potential trend reversals. 4. **Oscillator Visualization**: The…
-
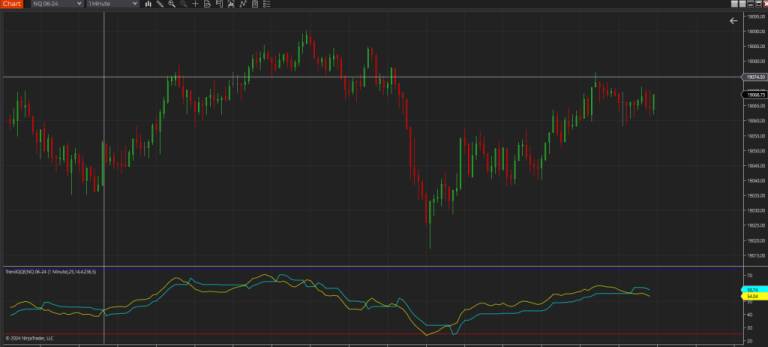
Dual Trend Indicator
DualTrendIndicator How to Use the Dual Trend Indicator The Dual Trend Indicator helps you identify potential trading opportunities by combining momentum analysis with trend detection. It is designed to work effectively on both Renko bars and time-based charts by allowing you to switch between parameter sets optimized for each chart type. Importance of Different Parameters for Chart Types: Renko Bars: Characteristics: Renko charts filter out minor price movements and focus on significant price changes, creating bricks of equal size. This results in smoother trends and clearer signals. Parameters: The default parameters for Renko charts are optimized to account for the reduced noise and different scaling inherent in Renko bars. Time-Based Charts:…
-
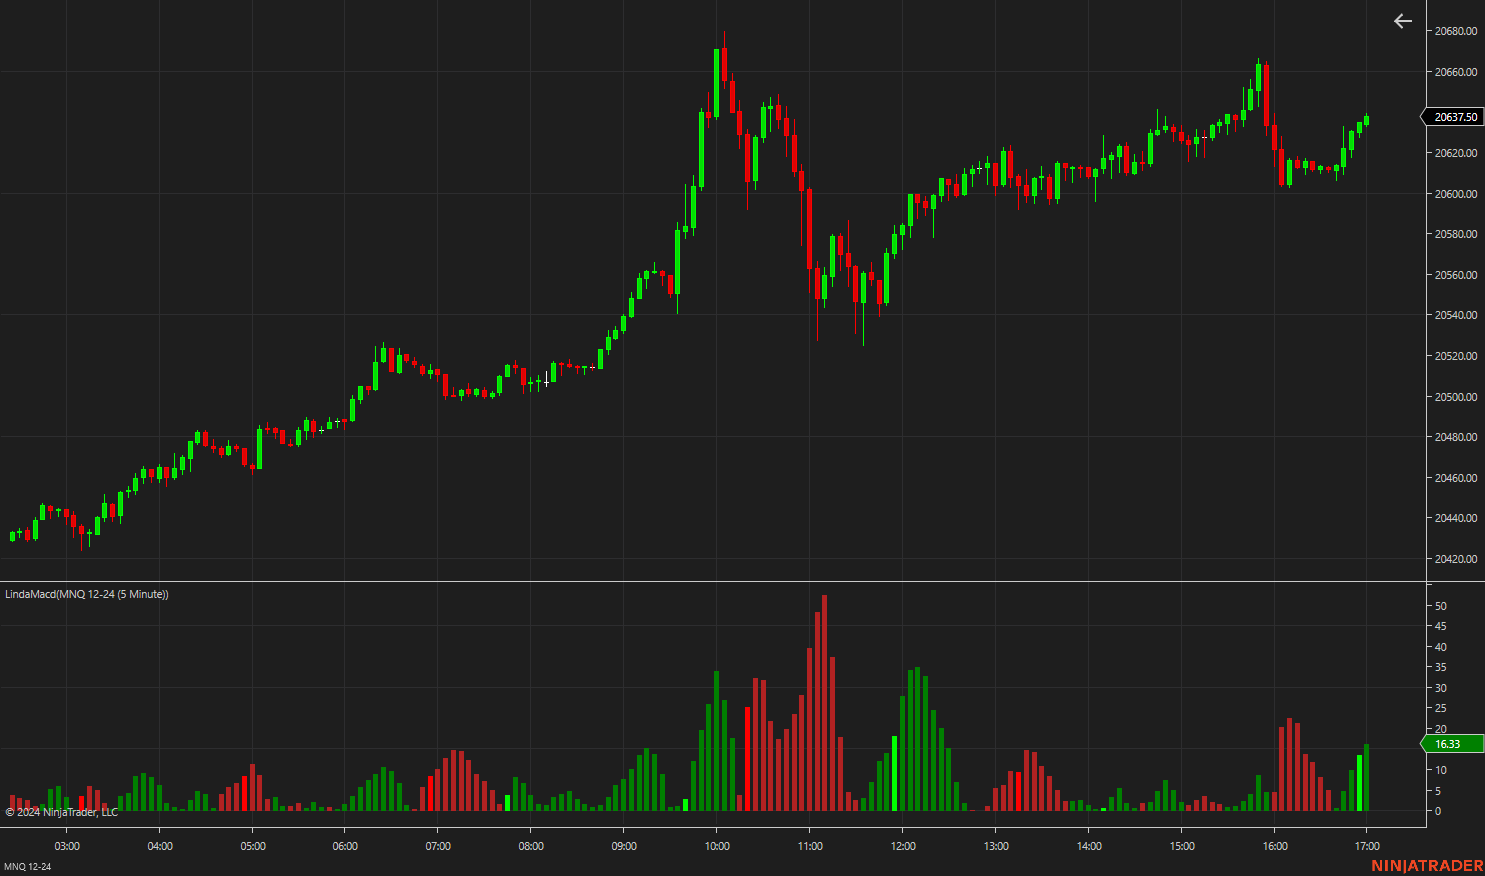
Linda Macd Indicator
Linda MACD Indicator The Linda MACD Indicator is a custom NinjaTrader 8 indicator designed to provide a histogram visualization for MACD-Signal line interactions. This indicator uses a fast SMA (3-period) and a slow SMA (10-period) to calculate the MACD line, with the MACD signal line being smoothed by an additional 16-period SMA. The resulting histogram shows the difference between the MACD and the signal line, dynamically changing colors based on trend direction and Parabolic SAR signals. Green indicates upward momentum, Firebrick for downward, Lime for strong upward moves, and Red for strong downtrends. It’s a useful tool for visualizing momentum shifts and potential trend reversals.
-
30SecOR With Historical Levels
This is an update of the previous version. In this new version, the Opening Range historical levels are saved and plotted on the chart Customizable Opening Range: Define the ORH (Opening Range High) and ORL (Opening Range Low) with adjustable start and end times minimum to be within 30 sec CME Opening Range. Extension Levels: Automatically plots 50% and 100% extension levels above and below the opening range, providing key price levels for potential breakout and pullback opportunities. Visual Customization: Tailor the indicator to your preferences with customizable colors, line styles, and text sizes. Info Integration: Includes site and Discord info, adding a personal touch for the user community. Developed by PropTraderz, this indicator enhances…
-
Sith Zeff Scalper Indicator
Sith Zeff Scalper Indicator Apex Trader Funding 80% OFF code PROPTRADERZ. 150K acc for 50$ after the discount and 85$ activation Fee The Sith Zeff Scalper Indicator isn’t just an indicator—it’s a comprehensive scalping strategy designed to capitalize on short-term market volatility. Whether you’re trading the Nasdaq (NQ) or other high ATR markets, this strategy helps you filter out market noise and focus on high-probability setups. Let’s break down the key components of the strategy, so you can fully understand how it works and apply it to your trading. Watch the video below to learn how to use it Core Elements of the Strategy The Sith Zeff Scalper focuses on…
-
Master Candle Signal
Master Candle Signal Indicator And How To Use Introduction Can find the same indicator for TradingView at the link below https://www.tradingview.com/script/zcs3vo1Q-Master-Candle-Breakout-V1/ Rules to follow around master candle trading strategy One primary rule that applies to the master candle is not to trade near the support/resistance If the support or resistance is closer than the size of the master candle, then refrain from trading Place a stop loss in the opposite direction of the trend at the other end of the master candle. For example, while entering a long position, the stop loss is placed at the low of the master candle An ideal master candle size is usually 30-150 ticks(percentage…
-
Optimus NinjaTrader Indicator
Optimus Prime Indicator by TraderOracle – Version: 1.8 Author: TraderOracle Discord: Join Our Community Overview The Optimus Prime Indicator by TraderOracle is a comprehensive technical analysis tool designed to help traders identify market trends, reversals, and key entry/exit points. With a wide array of customizable settings, the indicator incorporates several well-known strategies such as MACD, Parabolic SAR, Squeeze Momentum, Waddah Attar Explosion, Fisher Transform, SuperTrend, T3, Hull Moving Average (HMA), and Awesome Oscillator. These strategies work together to provide clear and actionable buy/sell signals. Optimus Prime is tailored for intraday and swing traders who need reliable signals based on volume imbalances, price action, and multiple technical filters. By analyzing key…