H
Indicators starting with H
-
HUD-Head Up Display Indicator /Strategy
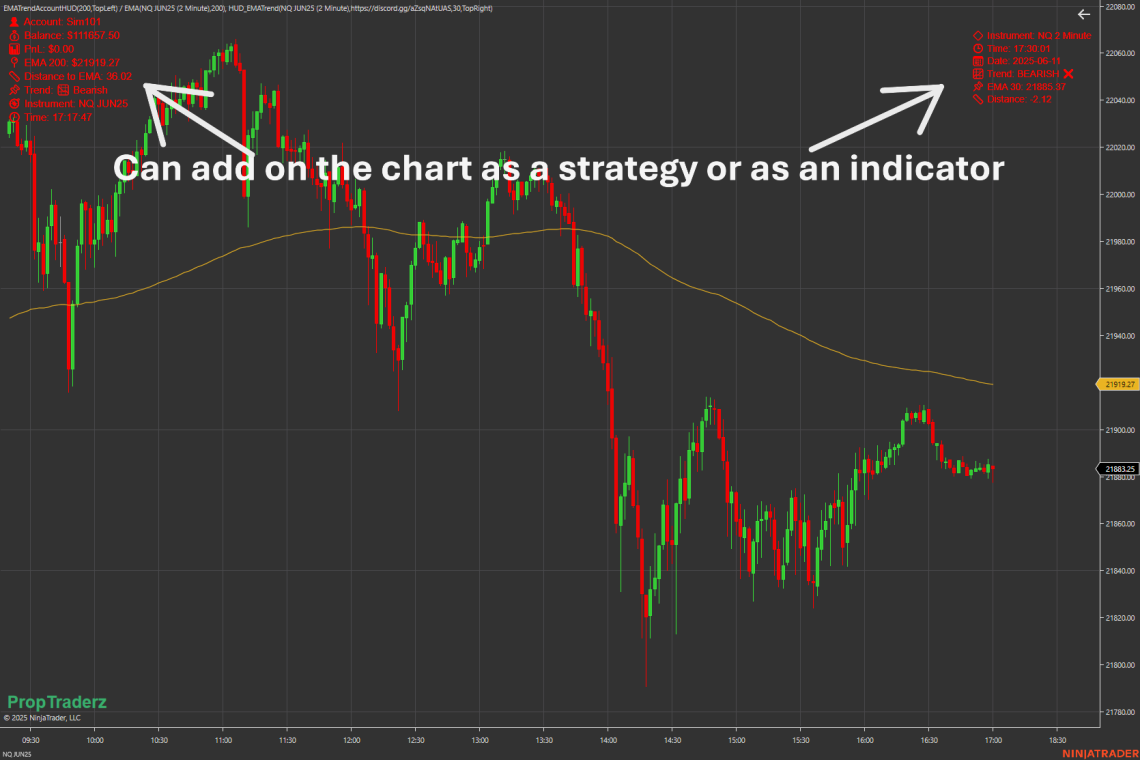
📊 HUD-Head Up Display Indicator or Strategy EMA Trend HUD Suite (Indicator + Strategy) 🔍 Overview The EMA Trend HUD is a lightweight, real-time information toolset for NinjaTrader 8, designed to give traders essential market insights directly on the chart — without clutter, lag, or unnecessary distractions. It comes in two parts: HUD_EMA Trend (Indicator) EMA Trend Account HUD (Strategy) Both tools display dynamic on-screen information based on a customizable EMA, helping traders visually interpret market bias, price positioning, and key account metrics with zero latency. 📌 HUD EMA Trend (Indicator) This overlay indicator provides a quick-glance panel showing: 🟢 Instrument name and interval ⏰ Real-time clock (updated per tick,…
-
HFTRsiScalp – High-Frequency Trading Scalping
The HFTRsiScalp – High-Frequency Trading Scalping indicator is designed to help identify potential long and short setups with a combination of RSI signals, swing highs/lows, and price action analysis. How HFTRsiScalp – High-Frequency Trading Scalping Works The indicator automatically detects potential double-bottom (bullish) and double-top (bearish) formations using swing high/low data and the ATR (Average True Range) for volatility assessment. For Long Entries: The indicator looks for two consecutive swing lows, where the second low is lower than the first. If the price breaks above the identified break level, a long entry signal is generated. The indicator then places a visual marker labeled “2B” and draws an entry line.…
-
Heikin Ashi RSI Oscillator – HARSI Free
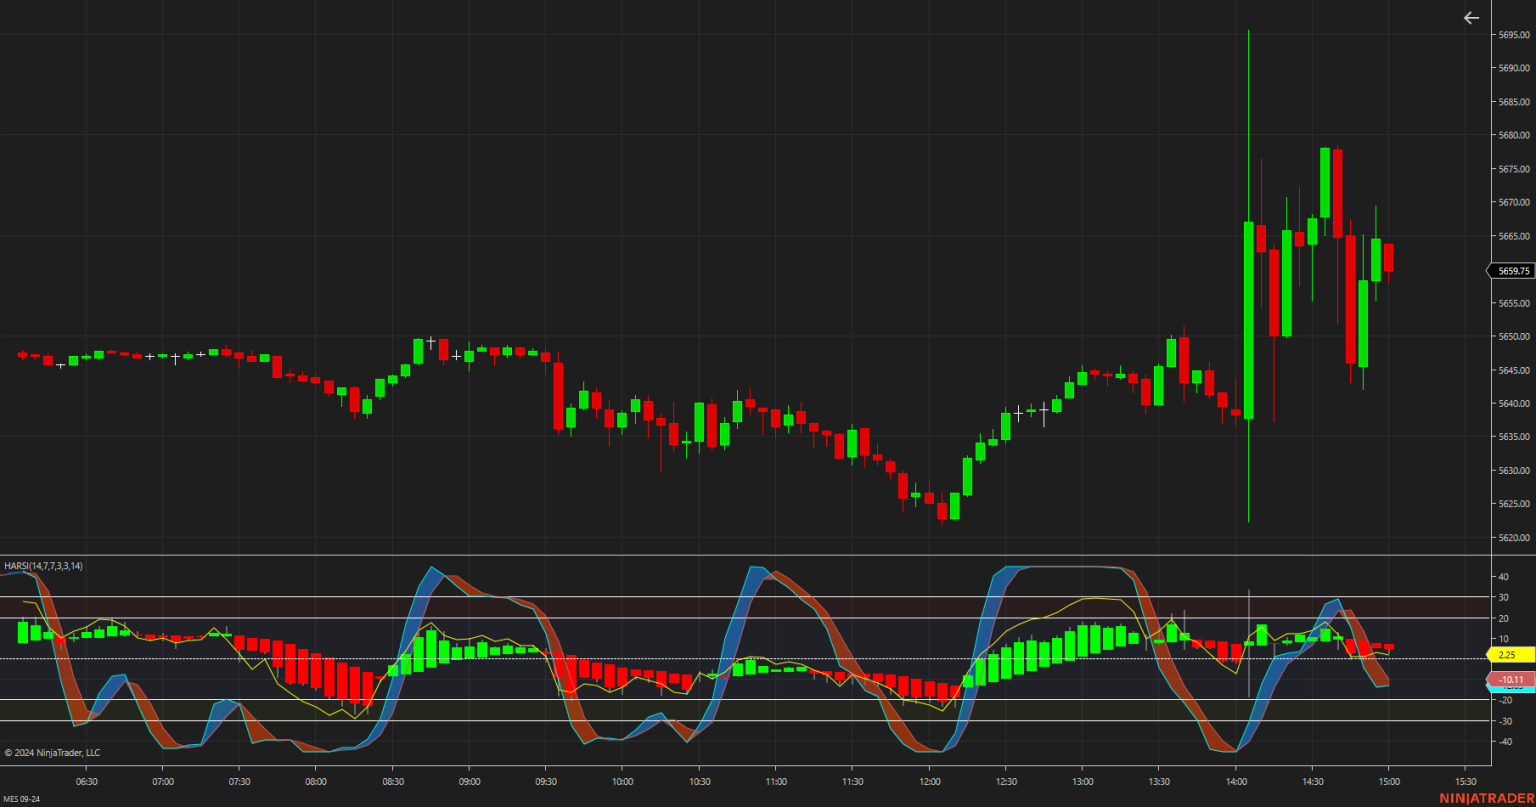
The **Heikin Ashi RSI Oscillator (HARSI)** combines two powerful indicators: **Heikin Ashi** candles and the **Relative Strength Index (RSI)**. It aims to smooth price data and highlight trends, while identifying overbought and oversold conditions. Key Features: 1. **Heikin Ashi Candles**: These candles smooth out price fluctuations, making trends easier to spot and filtering out noise from small price movements. 2. **RSI Calculation**: The RSI detects momentum and potential reversals by identifying overbought (when the asset is overvalued) or oversold (when the asset is undervalued) levels. 3. **Stochastic RSI Option**: The HARSI includes a stochastic version of the RSI, which provides further confirmation for potential trend reversals. 4. **Oscillator Visualization**: The…
-
Historical Price Projection-Lux Algo Free
The Historical Price Projection tool aims to project future price behavior based on historical price behavior plus a user defined growth factor.The main feature of this tool is to plot a future price forecast with a surrounding area that exactly matches the price behavior of the selected period, with or without added drift. Other features of the tool Historical Price Projection-Lux Algo include: – User-selected period up to 500 bars anywhere on the chart within 5000 bars User selected growth factor from 0 (no growth) to 100, this is the percentage of drift to be used in the forecast.- – User selected area wide – Show/hide forecast area Settings Data Gathering…
-
High/Low Envelope
High/Low Envelope Download Introducing the High/Low Envelope Indicator You can find some other free products like the High/Low Envelope also at www.scalpradar.com The High/Low Envelope, a dynamic tool plots the highest and lowest prices reached within a specified number of periods, offering insights into price movements. With default settings analyzing 14 periods, you have the flexibility to adjust properties to suit your preferences. Customize line style and colour, The possibility to choose to plot only high, low, or both, ensuring a tailored experience. Whether you’re identifying support/resistance levels or anticipating breakouts, this indicator provides clarity and precision. Easily navigate parameter settings to fine-tune your analysis. Enhance your trading strategy with…
-
Hammer Candlesticks Ninja Trader Addon
Hammer Candlesticks Ninja Trader Addon A simple script that changes the colour of the candle if the wick is larger than the candle snippet by WeyldFalcon . This script colours ‘Hammer/Inverted Hammer’ Bars based on percentage ratio Wicks/(High-Low). In addition, one can play sounds attached to the signal bars. Both Bar Color and Sound signals can be switched on/off by users in the indicator properties windows. KEY TAKEAWAYS Hammer candlesticks typically occur after a price decline. They have a small real body and a long lower shadow. The hammer candlestick occurs when sellers enter the market during a price decline. By the time of market close, buyers absorb selling pressure and push the…
-
How to trade chart patterns?
How to trade chart patterns? Have you ever looked at the chart and had a feeling of Deja-Vu? A feeling that the chart or candlestick pattern is repeating itself in some ways? This is because certain movements in the market keep repeating and for this reason, there are candlestick and chart patterns. Their history can be dated back to the very first discovery of Japanese candlesticks and nowadays they are a necessary part of technical analysis. On the internet, you may find unlimited information and study materials on this matter, and although there may be slight differences in each of the explanations, it is important to understand the most basic…
You May Also Like
Heikin Ashi RSI Oscillator – HARSI Free

High Probability Trading

High/Low Envelope
-
Harmonic Patterns- Scalper
Harmonic Patterns Harmonic patterns are a popular tool used by traders to identify potential reversal points in the market. These patterns are based on a series of Fibonacci retracements and extensions, which are derived from the golden ratio, a mathematical ratio found throughout nature. While the Gartley, Butterfly, and Crab patterns are commonly known harmonic patterns, there are alternative harmonic patterns traders can use to identify profitable trades. Harmonic Patterns can be very hard to spot and Automate in your trading Strategy. This indicator will magically spot for you the various patterns and enables you to use it in an Automated strategy and back-test its performance! This Indicator Detects 8…
-
High Probability Trading
High Probability Trading “High Probability Trading Strategies: A Complete Guide to Building a Winning Trading System” by Marcel Link is a book that provides an in-depth look at how to develop and implement high-probability trading strategies. The author covers various aspects of trading, including market analysis, risk management, and psychological factors, and provides a step-by-step guide for building and testing a trading system. The book also includes several case studies and examples of real-world trading scenarios to help illustrate the concepts discussed. This book is designed for traders of all levels, from beginner to advanced, and covers a wide range of markets, including stocks, futures, and forex. The author emphasizes…
-
How to become a funded trader
Becoming a funded trader involves a few steps, including gaining experience, building a track record, and finding a Prop Firm or funding company that is willing to invest in you. Here are some tips on how to become a funded trader: Gain experience: Before you can become a funded trader, you need to gain experience in trading. This can be done by trading with your capital, or by working as a trader at a firm. The more experience you have, the better your chances of becoming a funded trader. Build a track record: To become a funded trader, you need to be able to demonstrate that you have a track…