L
Indicators starting with L
-
Linda Macd Indicator
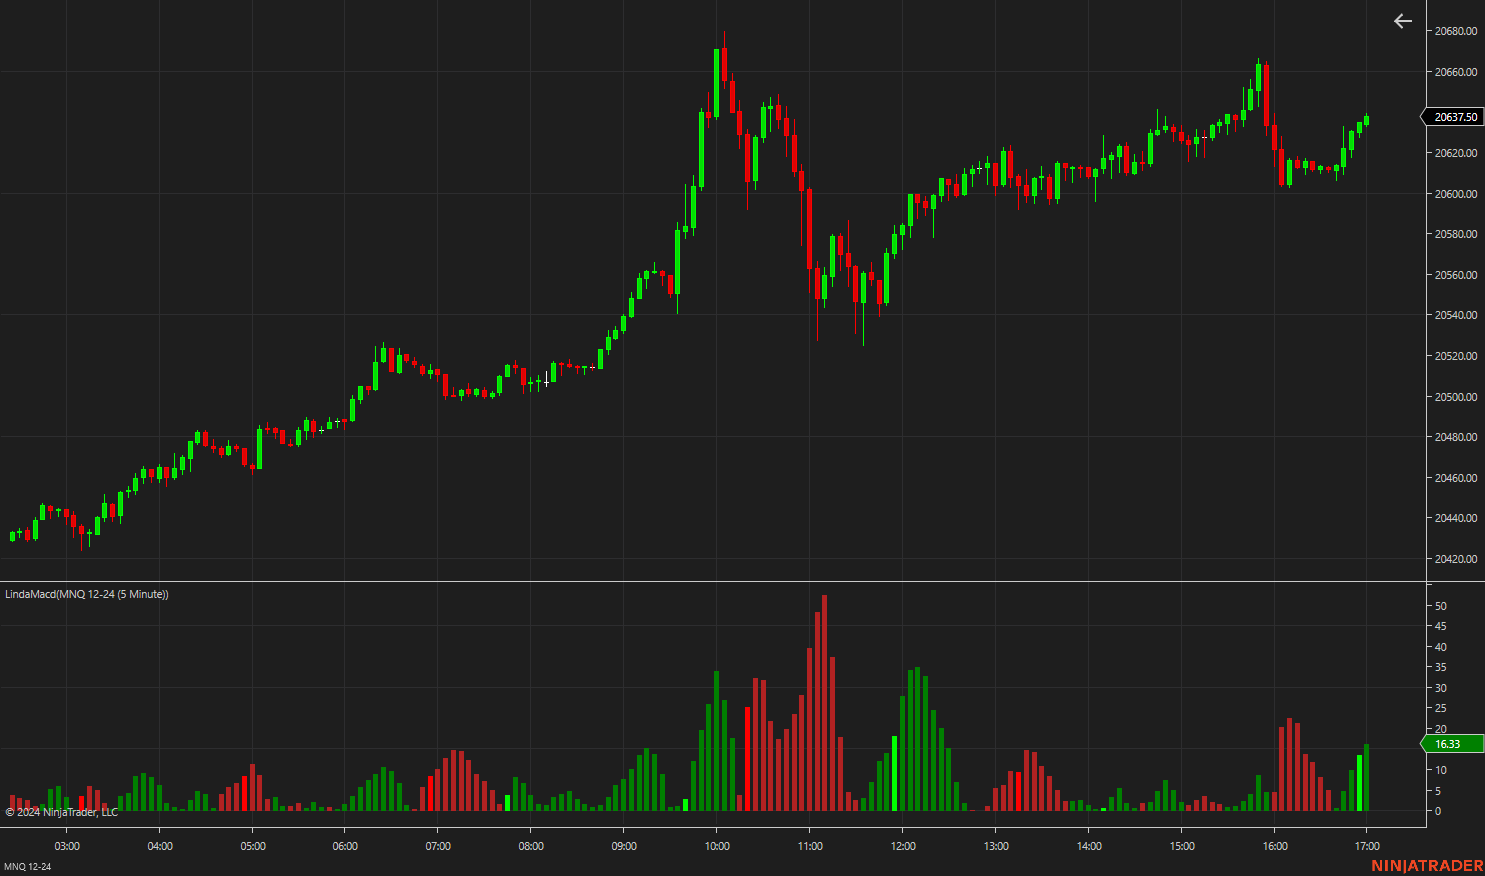
Linda MACD Indicator The Linda MACD Indicator is a custom NinjaTrader 8 indicator designed to provide a histogram visualization for MACD-Signal line interactions. This indicator uses a fast SMA (3-period) and a slow SMA (10-period) to calculate the MACD line, with the MACD signal line being smoothed by an additional 16-period SMA. The resulting histogram shows the difference between the MACD and the signal line, dynamically changing colors based on trend direction and Parabolic SAR signals. Green indicates upward momentum, Firebrick for downward, Lime for strong upward moves, and Red for strong downtrends. It’s a useful tool for visualizing momentum shifts and potential trend reversals.
-
LSMA SLOPE – Least Square Moving Average
Least Squares Moving Average (LSMA) The Least Squares Moving Average (LSMA) is a powerful tool for analyzing price trends in financial markets. Unlike traditional moving averages, the LSMA is based on a linear regression line that minimizes the squared differences between observed and predicted values, making it highly responsive to market conditions. In this article, we’ll explore what the LSMA is, how it works, and how an advanced indicator like the LSMA Slope with Offset can enhance trading strategies. What is the LSMA? The LSMA is a type of moving average that calculates the best-fit line through a set of data points, using a linear regression model. The line is…
-
Leg Counter
Leg Counter Free Indicator The Simple Leg Counter is used to count the pullbacks in a trend. A new trend will start at zero then begin counting every pull back until there is a reset. For example, an uptrend will begin at zero and the indicator will label each found pullback until a lower high is printed. Equal highs or equal lows will not reset the counter. Note that the indicator will recognized 1, 2 and 3 sequential equal high/low bars. It does not currently recognize more than 3 sequential equal bars. Basic font features can be changed such as the color, family, size etc. The margin from the tops/bottoms…
-
Liquidity Index for NT8
Liquidity Index for NT8 Liquidity is one of the most important signals traders can pay attention to in the market. It shows how market participants are feeding the price levels. It is not only with limit orders but also related with the speed that traders and institutions can answer for new price actions. Liquidity comes along with Volatility because they are proportional inversely and for the complete technical analysis over market movement, traders must watch both signals. QuantWise Trading provide this indicator as open code, and we explain the original concept and its respective algorithm. ∆L= ∆V/∆P Knowing that the liquidity variation is the volume variation over the price…