M
Indicators starting with M
-
MFIWaveProV1 NinjaTrader8
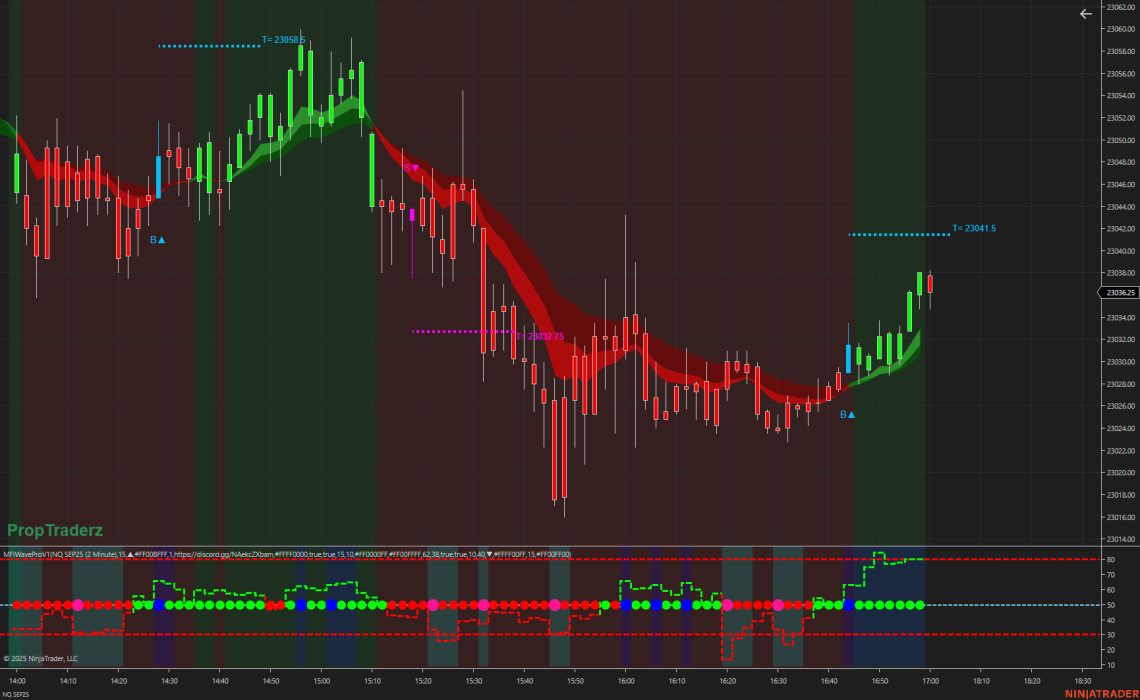
Introducing MFIWaveProV1: The Ultimate Dual-Panel Signal Engine Ready to take your trading visuals and signal precision to the next level? Meet MFIWaveProV1, the PropTraderz powerhouse indicator that combines trend-filtering EMAs, advanced entry logic, and ProZone-style MFI shading into one seamless package. Why You’ll Love It Crystal-Clear Trend Detection An 8/13/21 EMA ribbon on your price chart, with customizable bull/bear region fills and opacity, instantly shows you the prevailing market bias. Precision Entries & Profit Targets Our ATR-based trend bands, DI chop filter and strict MFI thresholds work together to trigger “B▲” and “S▼” arrows when all conditions align. Each signal comes with a dotted profit‐target line and price label so…
-
MTFCloudsV1: Precision EMA Clouds
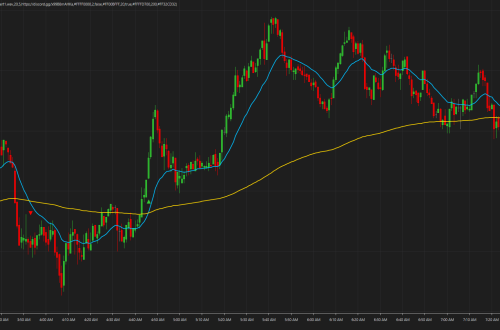
🚀 MTFCloudsV1: Precision EMA Clouds – Free NinjaTrader 8 At PropTraderz, we believe in equipping serious traders with powerful tools that are 100% free. ✅ What is MTFCloudsV1? MTFCloudsV1 is a multi-timeframe EMA indicator that draws two visual cloud zones on your chart, each based on independently customizable higher-timeframe EMAs. Whether you’re trading 1-minute scalps or swing setups on 30-minute charts, this indicator adds context and clarity without clutter. Key Features: ⚡ Supports any timeframe: Works on any intraday chart and lets you input any Higher TF in minutes (e.g. 15, 27, 196… no restrictions!) 🌈 Two customizable EMA cloud zones: “Fast” and “Slow” zones based on your favorite EMA…
-
MFI WAVE PRO
What Is MFI Wave Pro? MFI Wave Pro is designed to help traders identify potential market reversals and trend continuations by combining three key components: MFI (Money Flow Index) Signals:MFI is a momentum indicator that uses both price and volume to identify overbought or oversold conditions. In MFI WavePro, signals are generated when the MFI crosses specific thresholds (oversold and overbought levels). These signals are used to alert traders of potential buy or sell opportunities. EMA Trade Waves:Exponential Moving Averages (EMAs) are used to capture the market’s trend. By calculating and comparing multiple EMAs (fast, medium, and slow), MFI WavePro creates “trade waves” that visually represent bullish and bearish…
-
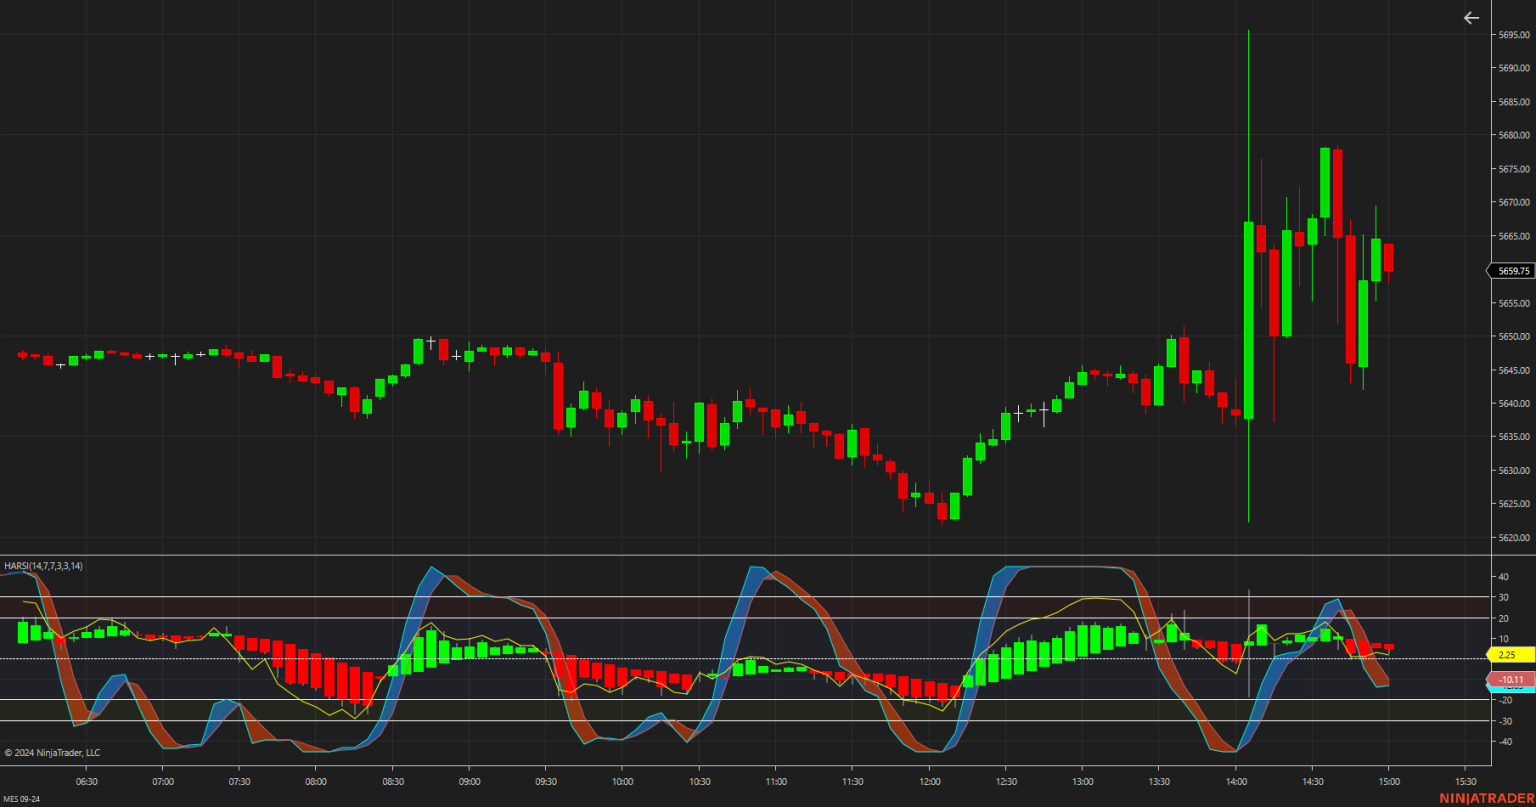
MFIProZone
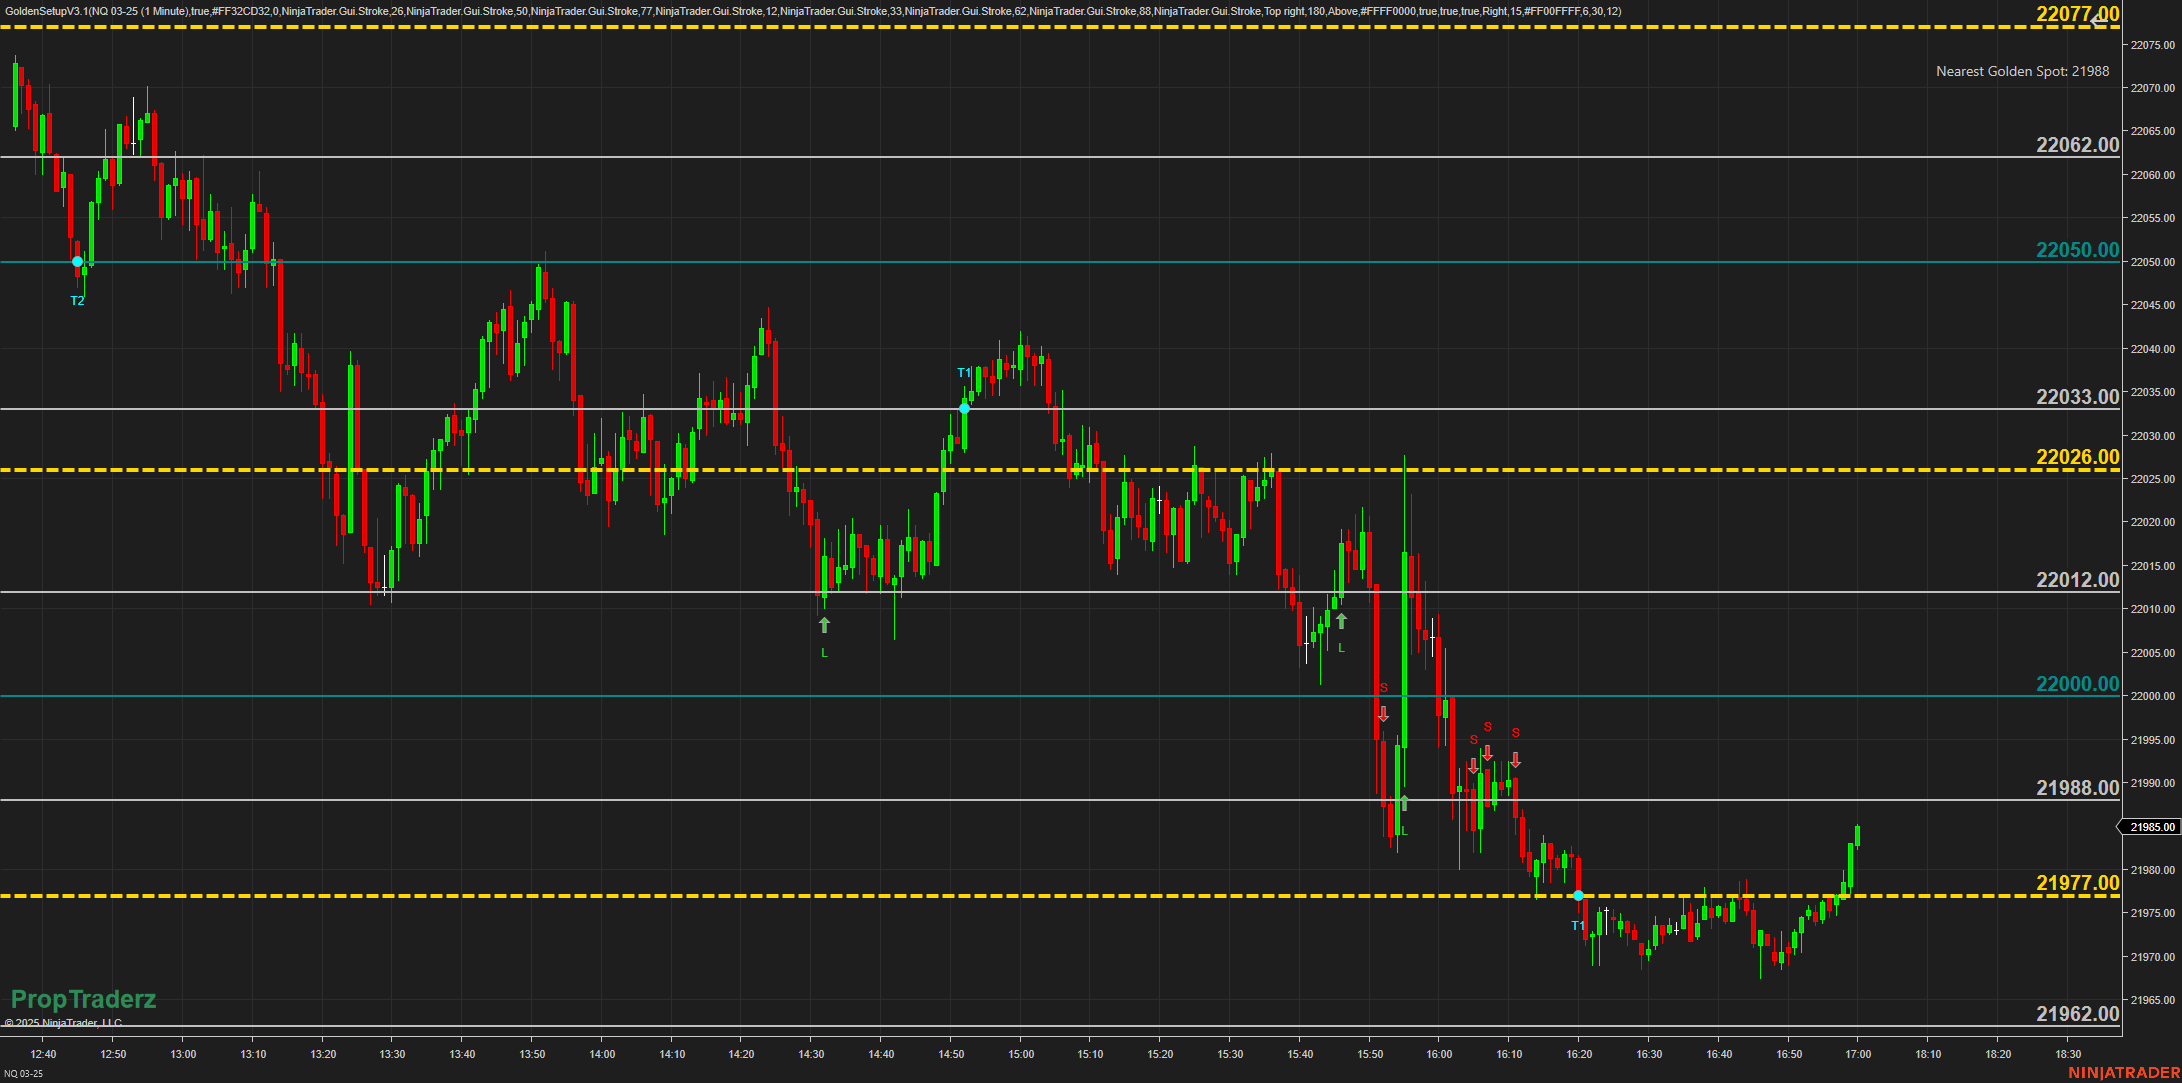
MFIProZone is a NinjaTrader 8 indicator that enhances the classic Money Flow Index with an optional ADX trend filter for clearer buy/sell signals and better avoidance of choppy markets. Key Features of MFI Refined MFIProZone Signals Above 50? MFIProZone plots a bullish color to help you spot positive momentum. Below 50? A bearish color indicates a potential downtrend. Overbought/Oversold Thresholds (e.g., 62/38) let you know when to watch for reversals. ADX Trend Filter ADX Above Threshold (often 25) means the market is trending. Signals only trigger in trending conditions, helping you avoid false trades in sideways markets. Clear Visuals & Alerts Background shading for extreme (90–100) or start (80–90)…
-
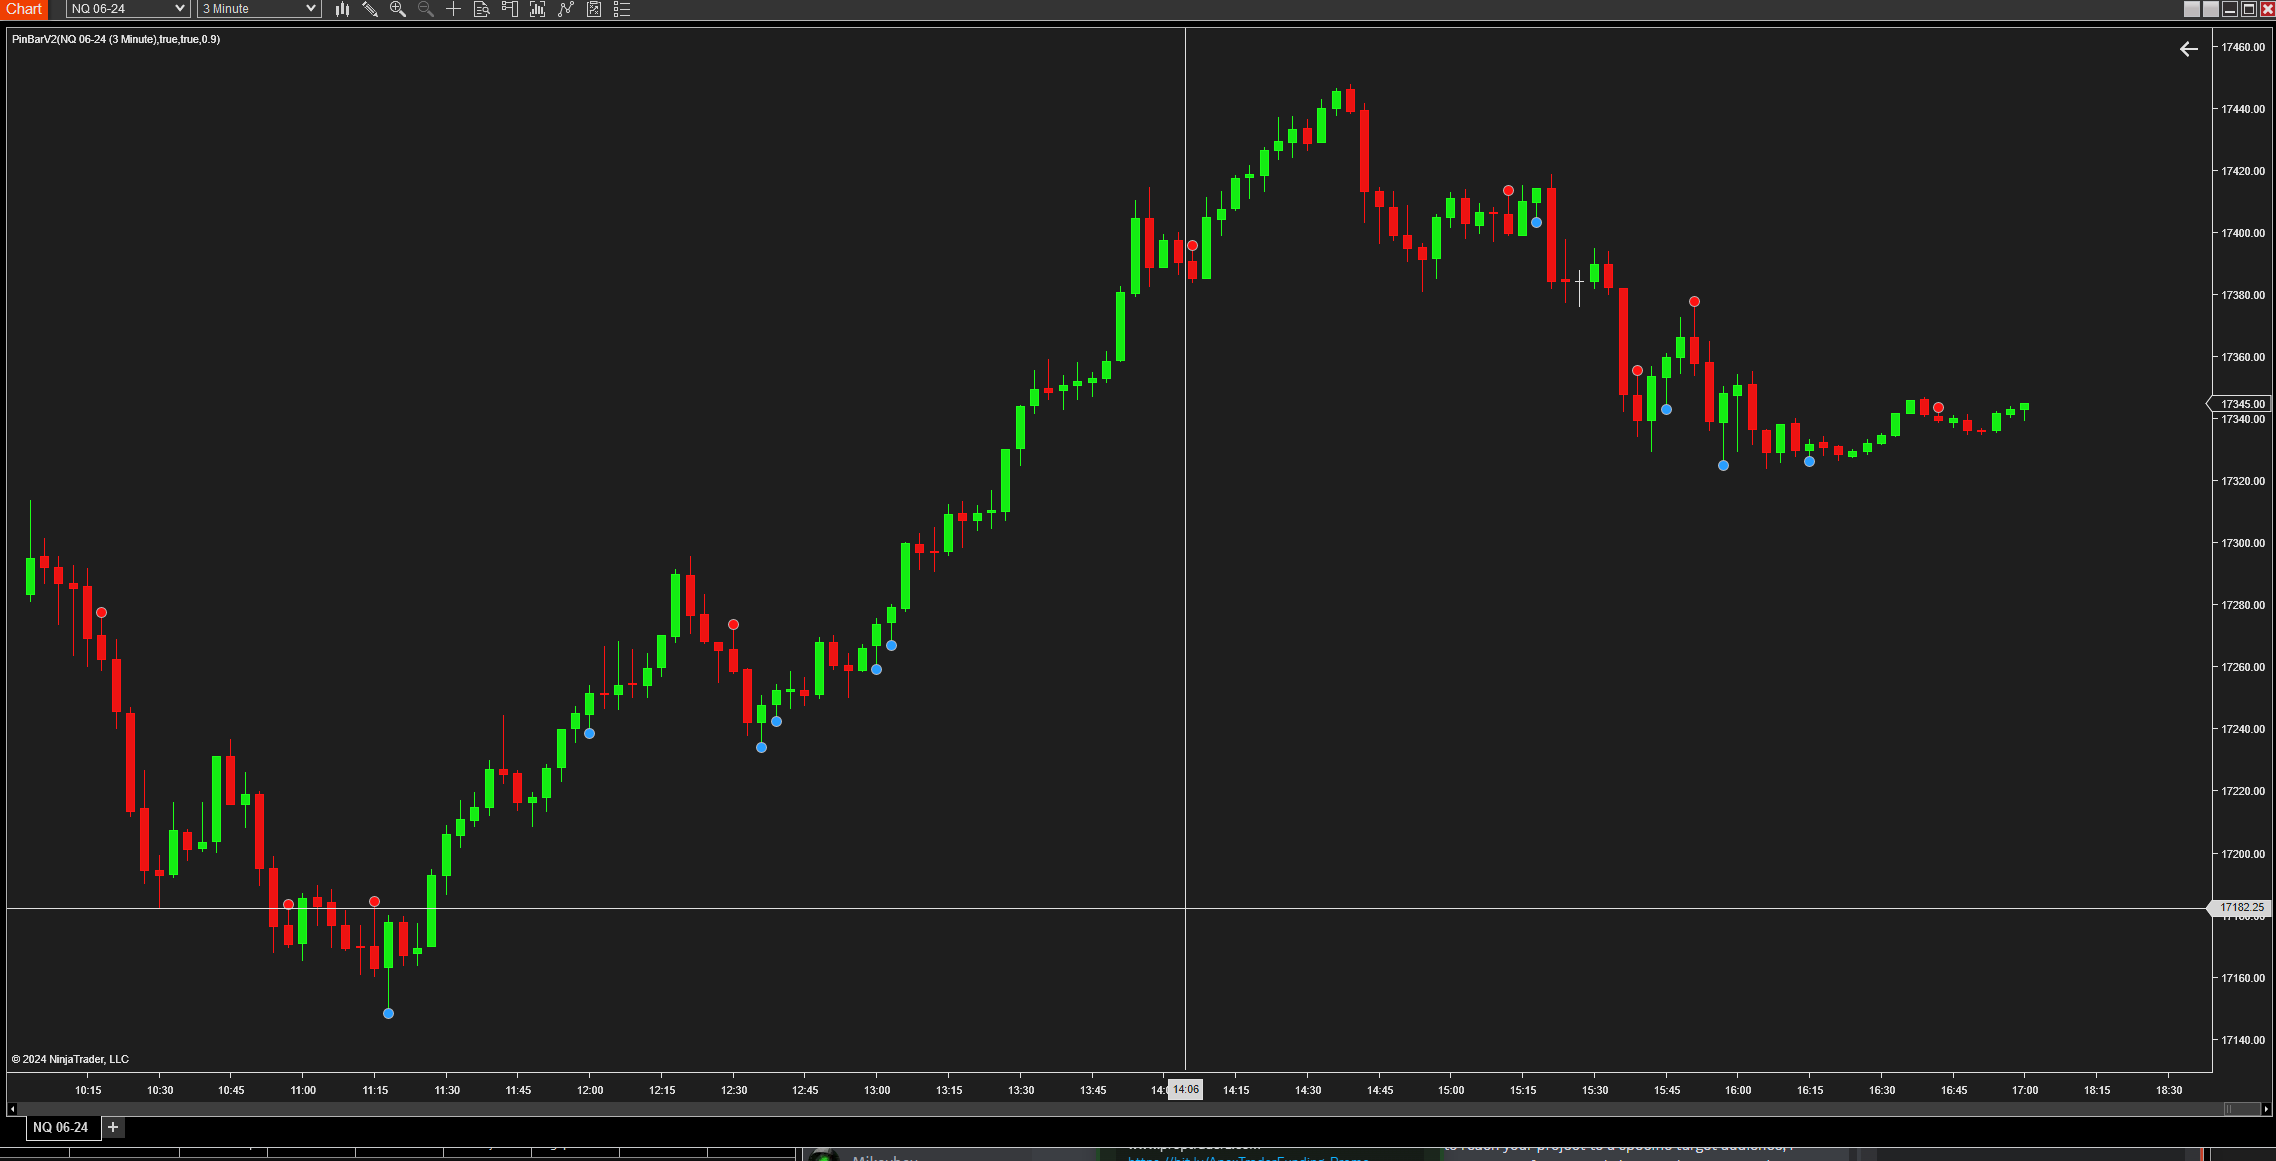
Master Candle Signal
Master Candle Signal Indicator And How To Use Introduction Can find the same indicator for TradingView at the link below https://www.tradingview.com/script/zcs3vo1Q-Master-Candle-Breakout-V1/ Rules to follow around master candle trading strategy One primary rule that applies to the master candle is not to trade near the support/resistance If the support or resistance is closer than the size of the master candle, then refrain from trading Place a stop loss in the opposite direction of the trend at the other end of the master candle. For example, while entering a long position, the stop loss is placed at the low of the master candle An ideal master candle size is usually 30-150 ticks(percentage…
-
Market Reversal CBC_Signals
CBC_Signals Indicator The CBC _Signals indicator is a sophisticated trading tool designed to enhance your trading strategy by leveraging a Candle-by-Candle (CBC) flip approach. Originally developed by MapleStax, this indicator provides clear visual signals directly on your price chart, helping you make more informed trading decisions. Key Features: – Higher Time Frame Analysis: The indicator allows you to specify a higher time frame for signal generation, offering a broader perspective on market trends. – Visual Signals: It draws arrows on the chart to indicate potential long and short positions based on the specified conditions. – Integration: Seamlessly integrates with the NinjaTrader platform, providing an intuitive and user-friendly experience. How It…
-
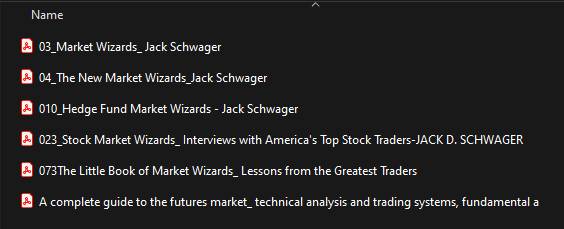
Market Wizards – Jack D. Schwager
Jack D. Schwager’s Market Wizards series stands as a beacon of insight and wisdom in the world of trading. With each edition, Schwager invites readers into the minds of the market’s most successful traders, offering invaluable lessons and strategies for navigating the complexities of financial markets. Through candid interviews and profound analysis, ‘Market Wizards’ equips traders with the knowledge and inspiration needed to thrive in ever-changing market conditions. From legendary investors to hedge fund managers, Schwager’s series illuminates the diverse paths to trading success, making it an essential read for traders of all levels. Full Series
-
Markets in Profile-James F. Dalton
Markets in Profile-James F. Dalton is a renowned book that delves into the concept of Market Profile and its application in understanding market behaviour and trading strategies. Here’s an overview of what the book is about: Market Profile Fundamentals: The book starts by introducing the reader to the basics of Market Profile. It explains how Market Profile is a unique method for analyzing financial markets, focusing on the auction process that determines price movements. Auction Process: “Markets in Profile” explores the concept of market auctions and how they contribute to price discovery. It examines how traders and investors interact in an auction-like fashion to determine fair prices. Trading Strategies: The…
-
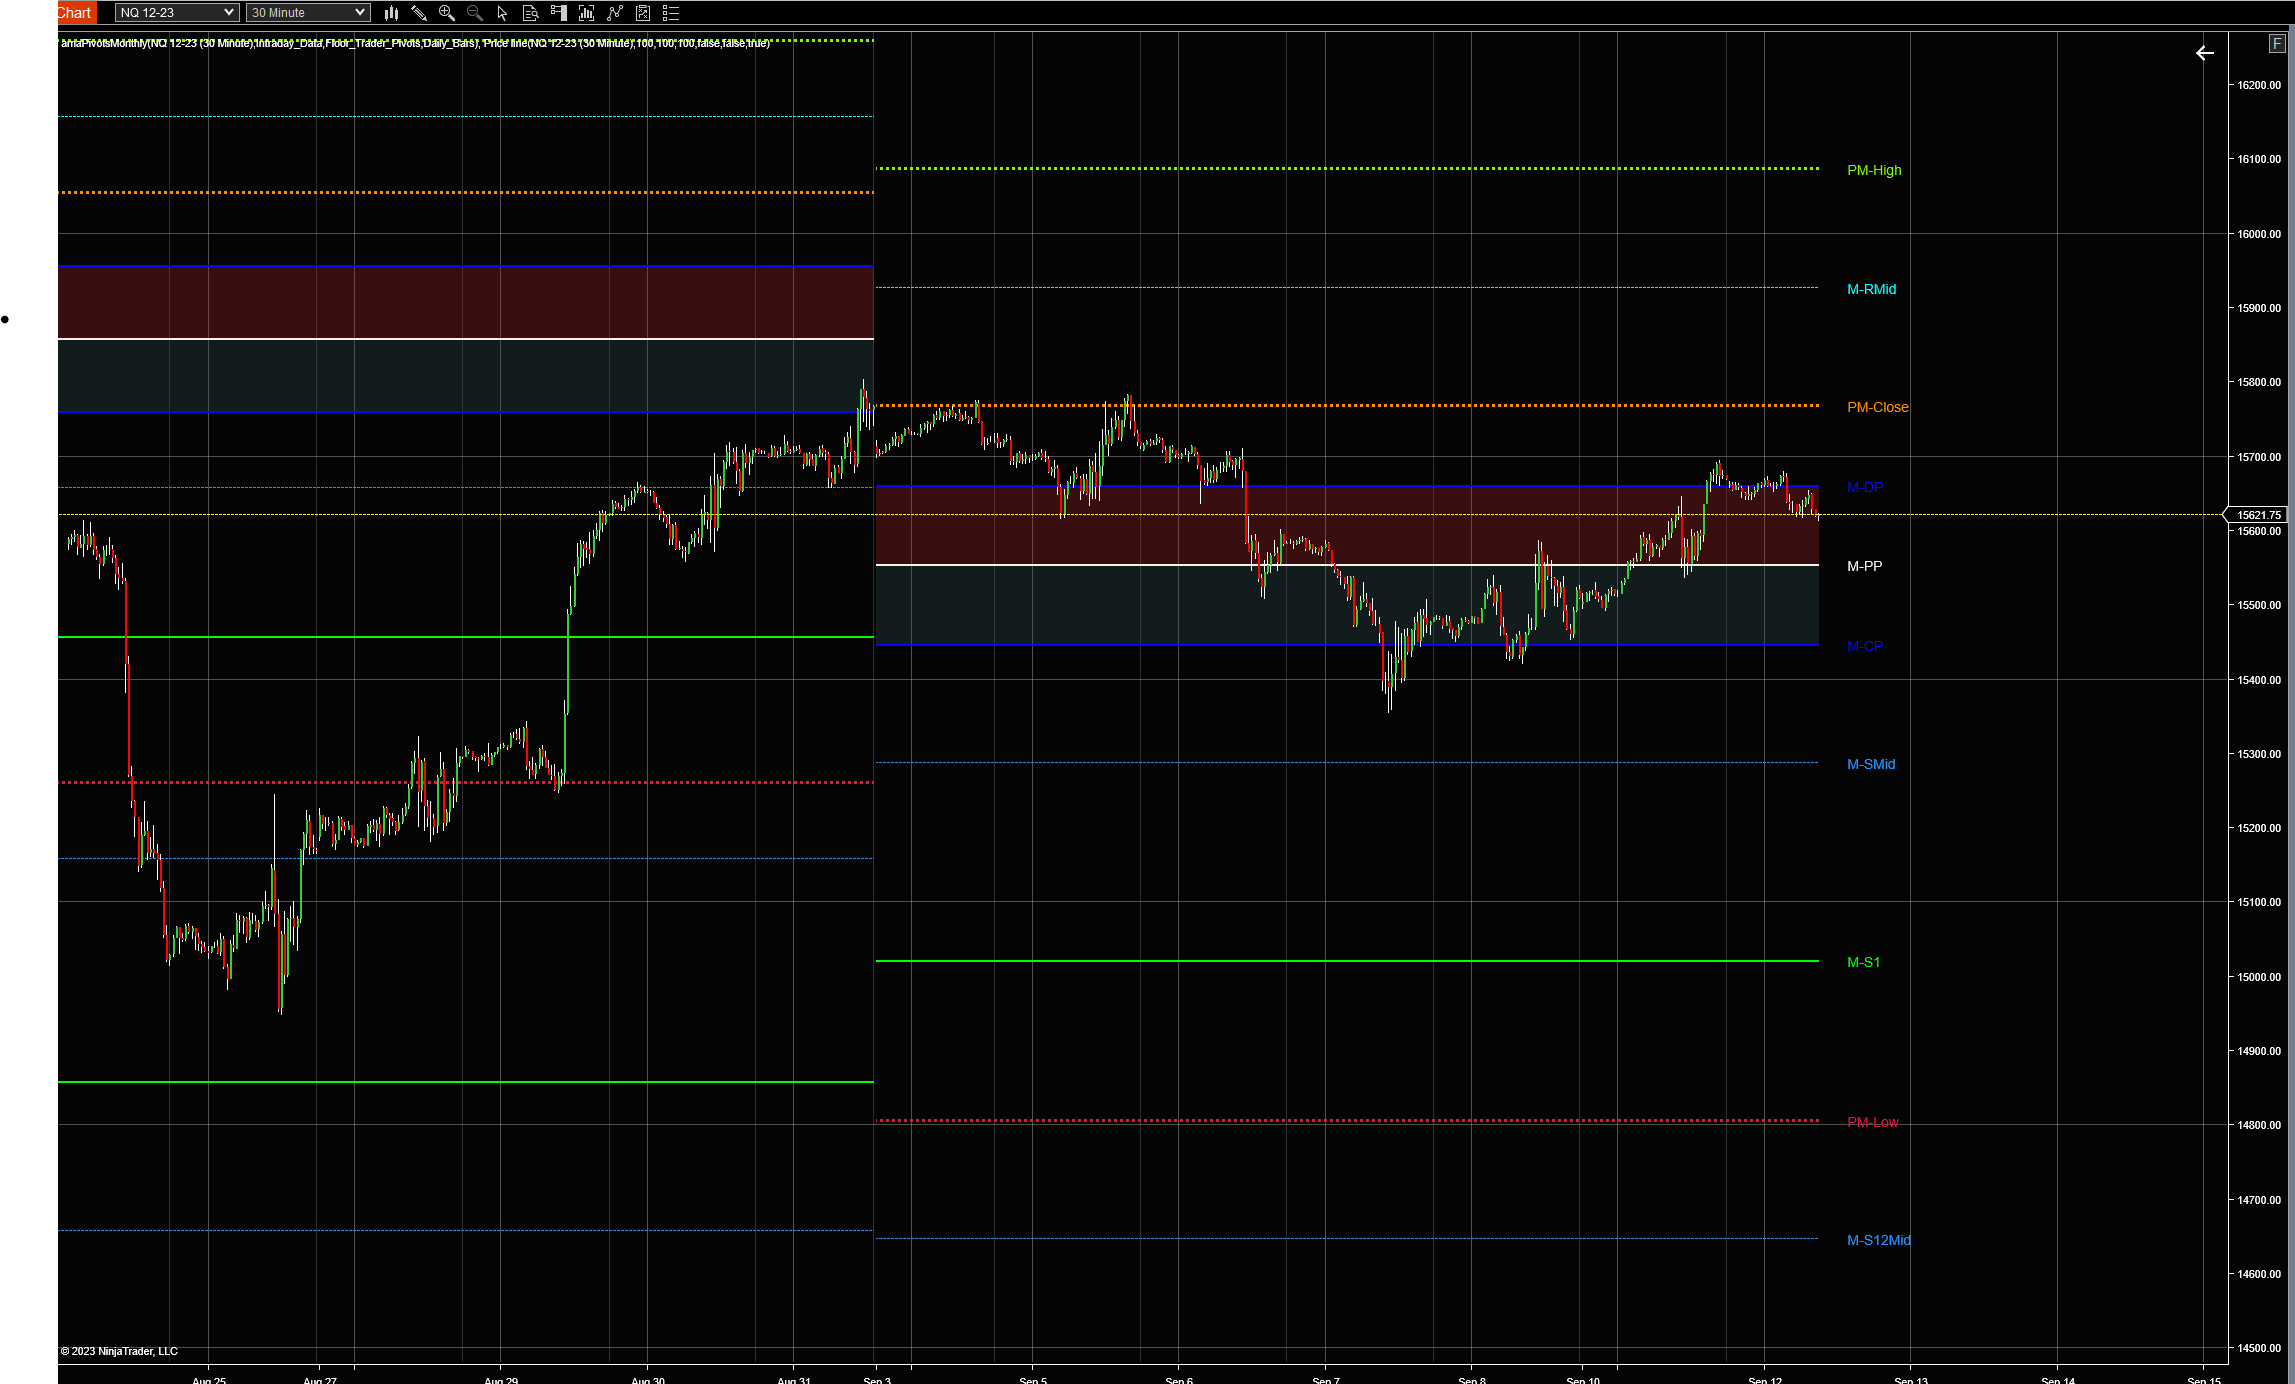
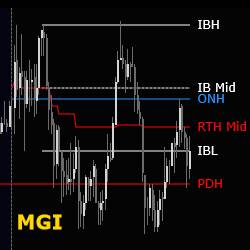
Market Generate Information (MGI)
Market Generate Information (MGI) by Trinitas Trading Many thanks to Trinitas Trading for this great free tool for Ninja Trader. In order to download must go in Trinitas website and download the tool for free Downloads This free MGI (Market Generated Information) indicator automates the process of adding useful information on your chart to help identify trading opportunities, market context and areas of interest to help guide decision making. Three indicators are offered for daily, weekly and monthly time frames. MGI Market Generate Information (MGI) is a set of key data points and metrics used by traders and analysts in Market Profile analysis. These metrics provide valuable insights into the…
-
Market Structures Lite -Ninja Trader
The Market Structures Lite -Ninja Trader indicator shows Break Of Structures (BoS) patterns and various swing points (High-high, Low-low, High-low and Low-high). This is a light indicator not a full customized, but still make its job pretty good. After install you can find it in Ninja Trader indicators under the folder FxStill ⇒ SmartMoney For a more advance version can take a look HERE Enjoy!