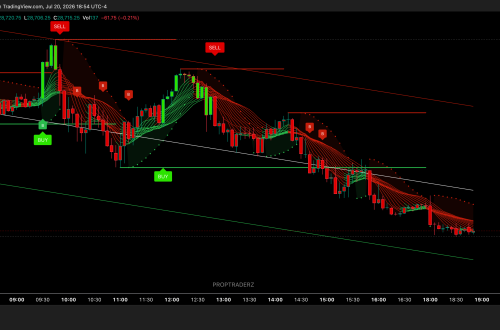

FootPrintV2 Chart for NT8
FootPrintV2 – Free NinjaTrader 8 Footprint Indicator
FootPrintV2 is a free NinjaTrader 8 footprint indicator that displays traded volume at each price level, helping traders analyze bid and ask activity, delta, volume profiles, imbalances and aggressive order flow directly inside the chart.
Unlike a traditional candlestick chart, FootPrintV2 reveals how much volume traded at individual prices within each bar. This provides a more detailed view of executed market activity and the interaction between aggressive buyers and aggressive sellers.
The indicator combines several order flow tools in one configurable NinjaTrader 8 package, including previous-session and developing volume profiles, custom profiles, cumulative delta, volume heat maps, bid-ask imbalances and a filtered tape strip.
Create a free account or login to unlock this download.
Free NinjaTrader 8 Footprint Indicator Features
FootPrintV2 includes several independent modules that can be enabled or disabled according to your preferred trading setup.
- Footprint chart with profile and numerical display modes
- Previous-session volume profile
- Current-session developing volume profile
- Configurable custom volume profiles
- Point of Control, Value Area High and Value Area Low
- High Volume Nodes and Low Volume Nodes
- Bid-ask imbalances
- Volume heat map
- Bar delta and cumulative delta
- Filtered tape strip for larger executed orders
- Quick switching between regular and footprint chart views
- Support for NinjaTrader global drawing objects
You can also vote for indicators and compare trading tools in the PropTraderz Indicator Radar, or browse the full collection of free trading indicators.
What Is a Footprint Chart?
A footprint chart is an order flow chart that displays trading activity at individual price levels inside each candle or bar.
Traditional candlestick charts show only how price moved during a selected period. A footprint chart adds another layer of information by showing where trades were executed and whether those trades occurred primarily at the bid or at the ask.
Depending on the selected configuration, footprint charts can display:
- Volume traded at the bid
- Volume traded at the ask
- Total volume at each price
- Bid-ask imbalances
- Positive or negative delta
- Cumulative delta
- High-volume and low-volume price areas
This information can help traders study the balance between aggressive buyers and aggressive sellers.
Why Traders Use a NinjaTrader 8 Footprint Indicator
Footprint charts are commonly used by scalpers, day traders and order flow traders because they provide a detailed view of completed market transactions.
A NinjaTrader 8 footprint indicator may help traders identify:
- Aggressive buying at the ask
- Aggressive selling at the bid
- Volume absorption near support or resistance
- Exhaustion near market highs or lows
- Failed breakouts and failed breakdowns
- Bid-ask imbalances
- Large-volume transactions
- Potential continuation or reversal conditions
A footprint chart does not predict future price movement. It provides additional context about completed trades and market participation. This information should be combined with market structure, risk management and a clearly defined trading plan.
How to Install the Free NinjaTrader 8 Footprint Indicator
To install FootPrintV2, download the indicator file and import it into NinjaTrader 8.
- Open NinjaTrader 8.
- Go to Tools.
- Select Import.
- Select NinjaScript Add-On.
- Choose the downloaded ZIP file.
- Complete the import process.
- Open a chart and add FootPrintV2 from the Indicators menu.
The FootPrintV2 indicator uses Tick Replay to calculate and display historical order flow information. You can learn more about this functionality in the official NinjaTrader Tick Replay documentation.
Tick Replay processes historical tick data and may require significant computer resources. Loading approximately three or four days of historical data is recommended as a starting point.
The appropriate amount of data depends on:
- The instrument being analyzed
- The selected timeframe
- The bar type
- The number of modules enabled
- The performance of your computer
If the footprint bars appear incomplete, distorted or visible only on the most recent bars, right-click the chart and select Reload All Historical Data.
FootPrintV2 Top-Bar Controls
FootPrintV2 adds a dedicated control menu to the top toolbar of the NinjaTrader chart.
Trades
The Trades button displays or hides trade-related information on the chart.
Map
The Map button enables or disables the volume heat map. The heat map visually highlights prices where higher or lower amounts of volume were traded.
Footprint
The Footprint button switches between the standard chart and the footprint chart.
This allows traders to perform market-structure analysis on a regular chart and activate the footprint only when price approaches a planned entry or exit area.
Settings
The Settings button opens the FootPrintV2 configuration panel. It is displayed when the footprint chart view is active.
Previous-Session Volume Profile
The previous-session profile displays the volume distribution from the completed trading session.
It includes:
- Previous-session high
- Previous-session low
- Point of Control, or POC
- Value Area High, or VAH
- Value Area Low, or VAL
- High Volume Nodes, or HVNs
- Low Volume Nodes, or LVNs
- Total traded volume
- Previous-session cumulative delta
These levels can provide context during the following trading session. Traders may monitor how price reacts around the previous POC, value-area boundaries, session high, session low and major volume nodes.
Current-Session Volume Profile
The current-session profile displays the developing volume distribution for the active trading session.
The profile updates as new trades are executed and includes:
- Current-session high and low
- Developing POC
- Developing VAH and VAL
- Current High Volume Nodes
- Current Low Volume Nodes
- Session volume
- Session cumulative delta
The developing profile can help traders monitor where the market is accepting price and where trading activity is concentrated.
A rising or falling Point of Control may also provide information about how the center of traded volume is shifting during the session.
Custom Volume Profile
The free NinjaTrader 8 footprint indicator includes a configurable custom volume profile.
The size of the custom profile can be defined using one or more of the following criteria:
- Percent: a percentage of current-session volume
- Bars: a specified number of chart bars
- Volume: a minimum amount of traded volume
- Range: a selected price range measured in ticks
These criteria may be combined. For example, you can require the custom profile to contain at least 10 bars and at least 10,000 contracts of traded volume.
The conditions are evaluated per completed chart bar. The final profile may therefore be slightly larger than the configured values.
Custom Profile Heat Map
The Map feature displays a heat map based on the volume traded at each price.
High-volume areas are shown more prominently, making it easier to identify prices where significant market participation occurred.
Custom Profile Imbalances
The Imbalances feature displays bid-ask imbalances on the right side of the custom profile.
These imbalances can highlight areas where aggressive buying or aggressive selling dominated the executed order flow.
Footprint Chart Display Modes
FootPrintV2 provides two main footprint display modes.
Profile Mode
Profile mode displays each price row as a horizontal volume profile.
This creates a visual representation of the relative volume traded at individual prices inside the bar.
Numbers Mode
Numbers mode displays numerical order flow values at each price level.
This format is useful for traders who want to analyze precise bid volume, ask volume, total volume, delta and imbalance information.
Profile mode is generally easier to interpret visually, while Numbers mode provides more detailed information.
Volume, Delta and Cumulative Delta
The lower area of the FootPrintV2 chart can display Volume, Delta or Cumulative Delta.
Volume
Volume shows the total number of contracts traded during each chart bar.
Delta
Delta represents the difference between volume executed at the ask and volume executed at the bid.
Positive delta indicates that more volume traded at the ask. Negative delta indicates that more volume traded at the bid.
Cumulative Delta
Cumulative Delta calculates a running total of bar delta over the selected session or chart period.
Traders often compare cumulative delta with price movement. For example, strong positive delta without upward price progress may suggest that aggressive buyers are being absorbed by passive sellers.
The size of the bottom area can be adjusted through the chart margin settings.
Tape Strip and Large Executed Orders
The Tape Strip prints executed orders at the bid and ask directly on the chart.
By default, the tape is filtered so that larger transactions are more visible. This reduces noise and helps traders focus on significant executed orders.
The filter may also be disabled to display a broader stream of market transactions.
The Tape Strip may help identify:
- Large trades entering the market
- Clusters of aggressive buying
- Clusters of aggressive selling
- High-volume activity near important levels
- Changes in order flow intensity
Large trades should not be interpreted as automatic buy or sell signals. Their relevance depends on location, market structure and the subsequent price reaction.
Global Drawing Objects and Market Context
NinjaTrader 8 supports global drawing objects that can appear across multiple charts of the same instrument.
This is particularly useful when using a footprint chart with only a few days of historical data.
You can maintain separate charts for:
- Higher-timeframe market structure
- Support and resistance levels
- Supply and demand zones
- Session highs and lows
- Execution and footprint analysis
Drawings created as global objects remain visible on the FootPrintV2 chart, even when the footprint chart loads a limited historical range.
How to Use the NinjaTrader 8 Footprint Indicator
The NinjaTrader 8 footprint indicator can be used for confirmation, execution analysis, continuation setups and potential reversal setups.
New users should begin by observing the relationship between price movement, volume, delta and imbalances before using the indicator for live trading decisions.
Step 1: Analyze Market Structure
Start with a regular chart and identify:
- The current market trend
- Important support and resistance levels
- Previous-session high and low
- Current trading range
- Higher-timeframe volume areas
Step 2: Identify Important Volume Levels
Monitor the previous and developing:
- POC
- VAH
- VAL
- HVNs
- LVNs
These levels can help identify areas where the market previously accepted or rejected price.
Step 3: Switch to the Footprint View
When price reaches an important level, activate the footprint chart and examine:
- Bid-ask imbalances
- Delta
- Cumulative delta
- Volume concentration
- Large tape transactions
- Price response to aggressive buying or selling
Step 4: Confirm or Reject the Setup
Order flow information is generally more useful when it appears at a meaningful technical level.
An imbalance in the middle of an undefined range may have less significance than an imbalance appearing during a failed breakdown at established support.
Step 5: Define Risk Before Entry
Before placing a trade, determine:
- Entry price
- Stop-loss location
- Profit target
- Maximum acceptable loss
- The condition that invalidates the setup
Footprint analysis does not eliminate trading risk.
FootPrintV2 Continuation Setups
The indicator may help confirm continuation conditions when:
- Price holds above an important support area
- Aggressive buyers continue trading at the ask
- Positive delta expands together with price
- The developing POC moves higher
- Sellers fail to push price below support
- Buy imbalances appear during a controlled pullback
The opposite conditions may support a bearish continuation scenario.
These observations should be combined with broader market structure rather than treated as isolated signals.
FootPrintV2 Reversal Setups
Potential reversal conditions may include:
- Strong aggressive buying without further upward price progress
- Strong aggressive selling without further downward price progress
- Delta divergence near a market extreme
- Large-volume absorption near support or resistance
- Repeated imbalances that fail to continue price
- A failed breakout above or below a major volume area
For example, large positive delta at resistance does not automatically indicate that price will continue higher. If aggressive buyers repeatedly trade at the ask but price fails to advance, a passive seller may be absorbing the buying activity.
Using FootPrintV2 for Entries and Exits
Some traders perform all analysis directly on the footprint chart. Others use a standard candlestick chart for market structure and activate FootPrintV2 only when price approaches a planned trading area.
A practical workflow may be:
- Identify the setup on a regular chart.
- Wait for price to reach the planned entry area.
- Activate the footprint chart.
- Analyze order flow confirmation.
- Execute or reject the trade.
- Use delta, volume and imbalances to manage the exit.
This approach can reduce information overload while preserving the advantages of detailed order flow analysis.
Using FootPrintV2 With Other Indicators
FootPrintV2 may be used independently or together with a limited number of complementary tools.
Possible combinations include:
- NinjaTrader Order Flow VWAP
- Volume profile
- Support and resistance levels
- Supply and demand zones
- Trend indicators
- Volatility indicators
One possible configuration is FootPrintV2 together with the standard NinjaTrader Order Flow VWAP without deviation bands and a Half-Trend indicator.
Avoid overloading the chart with unnecessary indicators. Footprint charts already contain a large amount of information, and excessive chart elements can make real-time decision-making more difficult.
NinjaTrader 8 Footprint Indicator Performance Tips
The indicator processes a significant amount of tick-level data.
To maintain stable chart performance:
- Load only the historical data you need
- Limit Tick Replay to approximately three or four days initially
- Disable modules that are not required
- Avoid opening too many footprint charts simultaneously
- Use appropriate timeframes and bar types
- Reload historical data when the footprint appears incomplete
- Monitor CPU and memory usage
Loading several weeks of Tick Replay data across multiple instruments may significantly reduce NinjaTrader performance.
Final Thoughts
FootPrintV2 combines footprint charts, session profiles, custom volume profiles, delta, cumulative delta, bid-ask imbalances, heat maps and tape information in one free NinjaTrader 8 footprint indicator.
The indicator can help traders study where volume is concentrated, how aggressive participants are entering the market and how price responds around important support, resistance and volume areas.
Footprint charts require observation and practice. Traders should first use the indicator in simulation and study the relationship between executed order flow and price movement before applying it to live trading.
Used as part of a structured trading process, FootPrintV2 can provide a more detailed view of market activity than a conventional candlestick chart alone.
Visit the PropTraderz Indicator Radar to vote for indicators, compare available tools and discover new releases. You can also browse the complete collection of free NinjaTrader indicators.
Free NinjaTrader 8 Footprint Indicator FAQ
What is the FootPrintV2 indicator?
FootPrintV2 is a footprint, volume profile and order flow indicator designed for NinjaTrader 8.
Is FootPrintV2 a free NinjaTrader 8 footprint indicator?
Yes. FootPrintV2 is available as a free download on PropTraderz.
Does FootPrintV2 require Tick Replay?
Yes. Tick Replay is required to process and display historical footprint and order flow data correctly.
How much historical data should I load?
Loading approximately three or four days is recommended as a starting point. The correct amount depends on your timeframe, instrument, bar type and computer performance.
Why does the footprint display only recent bars?
Historical tick data may not have loaded correctly. Right-click the chart and select Reload All Historical Data.
Does FootPrintV2 include volume profiles?
Yes. It includes previous-session, current-session and configurable custom volume profiles.
Can the indicator display bid-ask imbalances?
Yes. FootPrintV2 can display bid-ask imbalances and volume concentration at individual price levels.
Can I switch between a regular chart and a footprint chart?
Yes. The Footprint button in the chart toolbar allows you to switch between the standard chart and the FootPrintV2 chart.
Does FootPrintV2 display cumulative delta?
Yes. The bottom chart area can display Volume, Delta or Cumulative Delta.
Can the indicator be used for scalping?
Yes. Footprint charts are frequently used for scalping, day trading and detailed execution analysis.
Is FootPrintV2 a complete trading strategy?
No. FootPrintV2 is an analysis tool. Traders must define their own entries, exits, position sizing and risk-management rules.
Risk Disclosure
Trading futures, forex, stocks and other financial instruments involves substantial risk and may not be suitable for every trader.
FootPrintV2 is provided for informational and educational purposes only. It does not provide investment advice, financial advice or guaranteed trading signals.
Past performance does not guarantee future results. Test indicators and trading methods in a simulated environment before using real capital.
You May Also Like

Supertrend Indicator

OPENING RANGE ORB -NinjaTrader