RSIProZone
RSIProZone custom NinjaTrader 8 indicator enhances the standard RSI (Relative Strength Index) with optional ADX filtering—so you can quickly see when markets are trending and avoid sideways price action. With just a glance, you’ll spot buy/sell arrows when RSI crosses your chosen oversold/overbought thresholds. Plus, a subtle background color shift highlights extreme areas, so you know when to watch for potential reversals.
Send download link to:
RSIProZone
How It Works RSIProZone Indicator
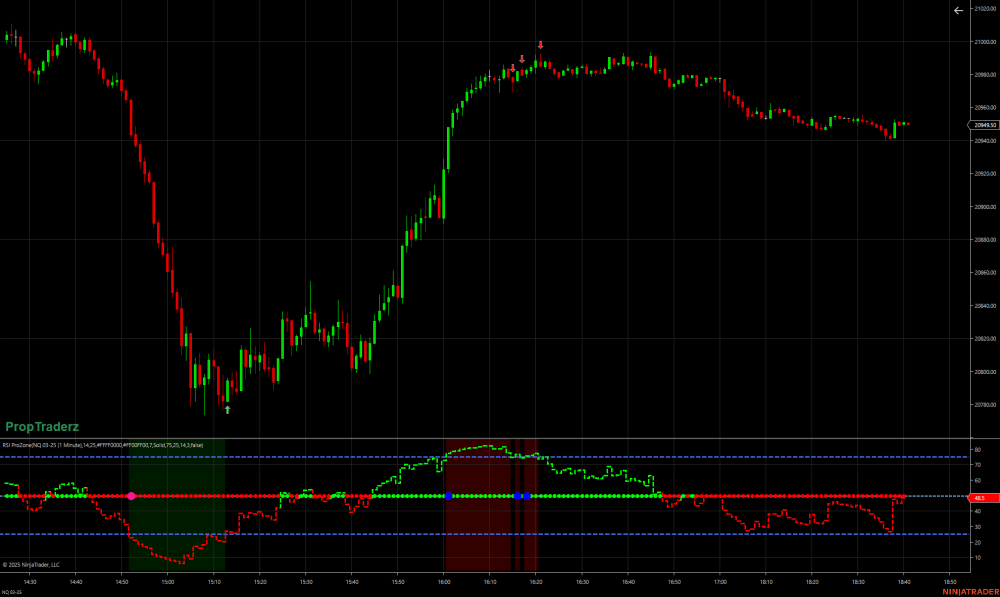
- RSI: A classic oscillator, defaulting to a 14-period calculation, with bullish (>50) or bearish (<50) color-coding.
- Signals: If RSI crosses above an oversold threshold (e.g., 25), you get a buy arrow; below an overbought threshold (e.g., 75), a sell arrow appears. Dots at the midline (50) show bullish or bearish momentum at a quick glance.
- ADX Filter: Turn it on if you want signals only when ADX (average directional index) exceeds a certain level—this helps you focus on trending markets.
- Extras: Horizontal lines for overbought/oversold, a “PropTraderz” watermark at the bottom-left, and plenty of color/style customizations.
Getting Started
- Simply add RSI ProZone to your chart from the NinjaTrader Indicators panel.
- Tweak RSI periods and thresholds, decide if you want the ADX filter, and pick your favorite colors.
- Watch for the background shading (green for oversold, red for overbought) and look out for arrows/dots to identify potential entries and exits.