Supply and Demand MT4/5
Supply and Demand Forex Indicator is your key to spotting essential supply and demand zones. These levels are represented as histograms, providing insights into market sentiment and potential price reversals. With customizable settings and color schemes, it’s a must-have in your trading toolkit.
Supply&Demand MT4
Send download link to:
Supply&Demand MT5
Send download link to:
The Indicator
The Supply and Demand MT4/5 is a versatile tool for spotting potential supply and demand levels. Let’s dive into what it does and its important functions and features.
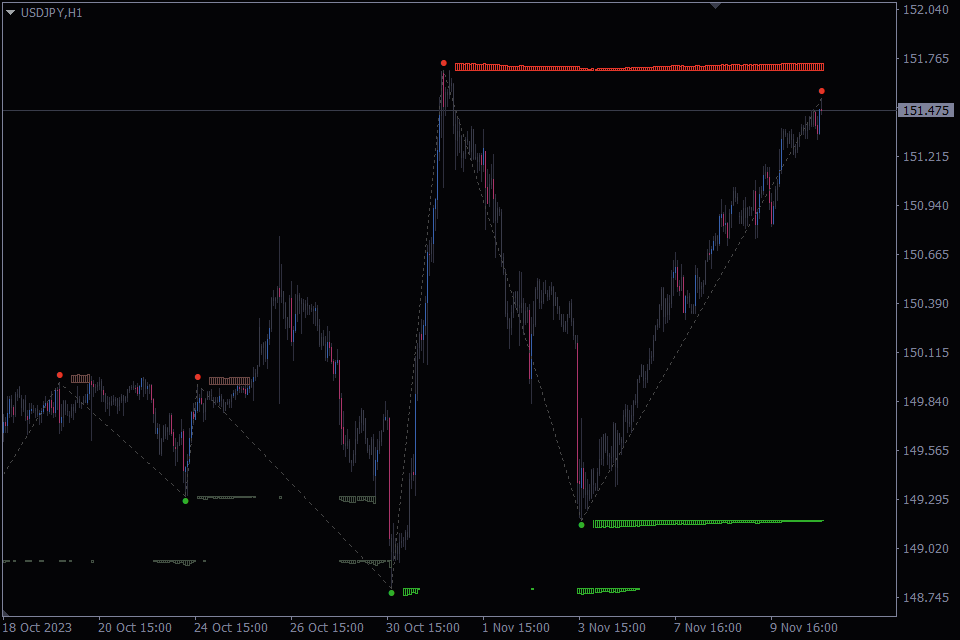
1. Histogram Display: The indicator represents potential supply and demand zones as histograms on the chart. These histograms provide a visual representation of the market’s willingness to buy (demand) or sell (supply). Supply is displayed above the price in red, while demand is shown below the price in green.
2. Volume Information: The histogram’s height indicates the strength of the supply or demand at a specific level. The closer the price is to a level, the larger the volume displayed in the histogram. This helps you understand how important these zones are.
3. Active/Inactive Levels: When the price breaks through a supply or demand level, you’ll notice that the indicator shows that level as inactive by displaying it with slightly lighter colors. This feature keeps you informed about the levels that are currently active and relevant.
4. Customizable Color Schemes: The indicator offers three pre-built color templates for both dark and light chart backgrounds. Traders can also create custom color schemes, tailoring the appearance to their preferences.
Algorithm Behind the Indicator:
The Supply and Demand Forex Indicator operates on a well-defined algorithm, which integrates the ZigZag pattern to identify significant price levels. Here’s a breakdown of how this indicator works:
1. ZigZag Pattern: The algorithm begins with the ZigZag pattern, which tracks the highs and lows in the price chart. This pattern is crucial for recognizing price swings and helps in pinpointing potential supply and demand zones.
2. Supply and Demand Levels: Using the information derived from the ZigZag pattern, the indicator identifies significant supply and demand levels. These levels are represented as histograms on the chart.
3. Volume Assessment: The height of the histograms isn’t arbitrary; it’s determined by the proximity of the price to these supply and demand levels. The closer the price is to a level, the larger the volume displayed in the histogram.
By combining the ZigZag pattern with the identification of supply and demand levels, this indicator offers a comprehensive view of potential price movements and market sentiment.
How the Indicator Can Be Used by Traders
The Supply and Demand Forex Indicator empowers traders by helping them identify potential areas of significant price movement. Here’s how you can utilize this indicator to enhance your trading strategy:
1. Zone Identification: Easily spot potential supply and demand zones on your charts. These zones are where traders are most likely to place orders, making them key levels to watch.
2. Strength of Levels: The histogram’s volume data shows how strong the supply and demand are at certain levels. This helps you understand the market mood and make smarter trading choices.
3. Price Reversals: Supply and demand zones often act as support and resistance levels. Traders can use them to identify potential price reversals or breakout opportunities.
4. Risk Management: By understanding the dynamics of supply and demand in the market, you can better manage your risk. Consider adjusting your stop-loss and take-profit levels based on the information provided by the indicator.
To become even better at trading with supply and demand zones, we recommend checking out our detailed guide: “Supply and Demand in Forex – How to Master Zone Trading.” It’s a valuable resource for improving your skills in this area.
Indicator Settings Description
To make the most of the Supply and Demand Forex Indicator, it’s crucial to understand its settings. Here’s a brief overview of the various options available:
ZigZag Settings: This setting allows you to define the depth and backstep for the ZigZag pattern calculations. It influences how sensitive the indicator is in identifying significant price swings.
“Indicator Settings” block
Number of Bars to Calculate: This setting enables you to specify the number of bars that the indicator uses for its calculations. While increasing this parameter can provide a more comprehensive view of potential supply and demand levels, it’s important to note that setting it too high may lead to performance lags in the MT4 terminal, potentially slowing down the indicator’s responsiveness. Balancing the value based on your trading requirements is essential to ensure optimal performance.
Histogram Height Percentage: This setting determines the height of the histogram bars relative to the chart. It’s important to note that instead of relying solely on the “Number of Bars to Calculate” parameter, the calculation of the histogram height is influenced by the “Bars Used for Calculating the Histogram Height” setting.
Bars Used for Calculating the Histogram Height: This parameter is not directly involved in calculating the volume but plays a pivotal role in determining the visual height of the histogram. By setting the number of bars here, you control the representation of supply and demand levels in the histogram, impacting its visual appearance without affecting the accuracy of volume information.
Infill Histogram: This option allows you to toggle the filling of histogram bars. When enabled, the bars are solid, creating a more substantial appearance. Disabling it results in bordered bars.
“Diplay Settings” block
Mark Peaks and Lows: By enabling this option, you can have the indicator mark peaks and lows on the chart, making it easier to identify significant price swings.
Peaks and Lows Dot Size: Adjust the size of the dots that mark peaks and lows on the chart. This customization helps improve the visibility of these critical price levels.
Draw ZigZag: This setting allows you to enable or disable the display of the ZigZag pattern on your chart. You can choose to show or hide this classic price swing pattern.
Line ZigZag Width: Customize the width of the lines that represent the ZigZag pattern. Adjusting this parameter allows you to control the visibility of the pattern on your chart.
Line ZigZag Type: Choose from five line types—dot, solid, dash, dashdot and dashdotdot.
“Color Presets” block
Preset Colors: You can select from three pre-built color themes designed for both light and dark chart backgrounds. These themes make it easy to customize the indicator’s visual style.
Custom Color Settings: For a more personalized touch, this setting allows you to define custom colors for each supply and demand level. It offers complete control over the visual presentation of the indicator, so you can tailor it to your preferences and trading style. To activate this feature, make sure to select the “Custom” preset in the setting above.
In conclusion, the Supply and Demand Forex Indicator is a valuable tool for Forex traders seeking to gain an edge in their trading strategies. By providing clear visual representations of potential supply and demand zones, along with volume information, this indicator enhances your ability to make well-informed trading decisions.
How to install Supply&Demand in MT4/MT5
Follow the instructions below to install the Indicator to your MT4 or MT5 terminal:
1. Download the ZIP-archive with Supply&Demand indicator file by clicking the link at the top of the page;
2. Unzip the file into the MQL4/5 indicators folder of your terminal;
3. Restart the MT4/MT5 terminal;
4. Run the indicator by double clicking the indicator name in the MT4/5 Navigator;
5. Check the “Allow DLL imports” box and click “OK”;
6. The indicator will be displayed on the chart;
7. Adjust the indicator’s settings according to your needs: press CTRL+I, select the indicator from the list, and switch to the “Inputs” tab.


