-
Trade Detector V2 Free
Functionality: Transaction Detection: TradeDetectorV2’s core function is to identify and display major transactions within a very short timeframe at specific price levels. It particularly focuses on limit orders where large volumes are traded at the same price. It classifies the magnitude of these transactions using three different volume thresholds (500, 1000, and 1500(customizable)). It is recommended when switching from Minis to Micros to increase the volume threshold Visual Signals: When a significant transaction is detected, the indicator visually marks this event on the chart with: Dots: Colored green for bullish transactions (buying) and purple for bearish ones (selling). Lines: These extend from the transaction price to the current median…
-
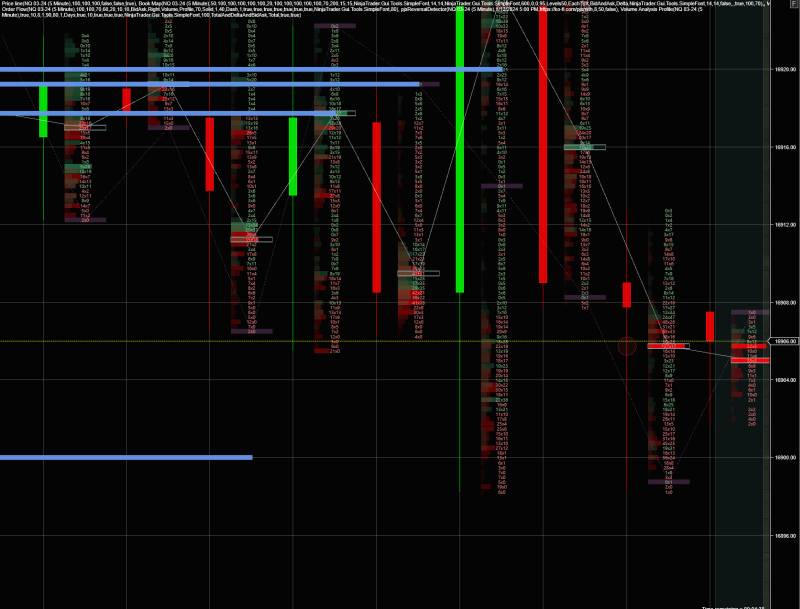
NT8-OrderFlow kit
This NT8-OrderFlow kit is a volume analysis toolkit, it is focused on all Futures markets it is based on the Wyckoff method Description: This NT8-OrderFlow kit is a volume analysis toolkit with which you can access to the Bookmap, Order flow, Market volume, Market filter and Volume profile. I designed these tools to be used for investment funds, banks, retail traders, among other entities. With them, you will be able to detect high-frequency trading, contract volume, type-reading, inefficiencies, accumulation, manipulation and other techniques related to professional volume analysis. Many thanks to Gabriel Zenobi for releasing this as NT8-OrderFlow kit a free version! This project is open source, my full code and…
-
FootPrintV2 Chart for NT8
In trading, a footprint chart is a type of price chart that displays the volume of trades at each price level, rather than simply showing the price movements over time. Footprint charts are often used by traders to identify support and resistance levels, track the buying and selling pressure in the market, and detect potential trend reversals. A footprint – FootPrintV2 Chart for NT8 chart works by dividing the price range into small price increments, and then displaying the volume of trades that occurred at each price level using different colours or shades. The resulting chart shows the distribution of trading activity across the price range, highlighting areas of high…