-
LSMA SLOPE – Least Square Moving Average
Least Squares Moving Average (LSMA) The Least Squares Moving Average (LSMA) is a powerful tool for analyzing price trends in financial markets. Unlike traditional moving averages, the LSMA is based on a linear regression line that minimizes the squared differences between observed and predicted values, making it highly responsive to market conditions. In this article, we’ll explore what the LSMA is, how it works, and how an advanced indicator like the LSMA Slope with Offset can enhance trading strategies. What is the LSMA? The LSMA is a type of moving average that calculates the best-fit line through a set of data points, using a linear regression model. The line is…
-
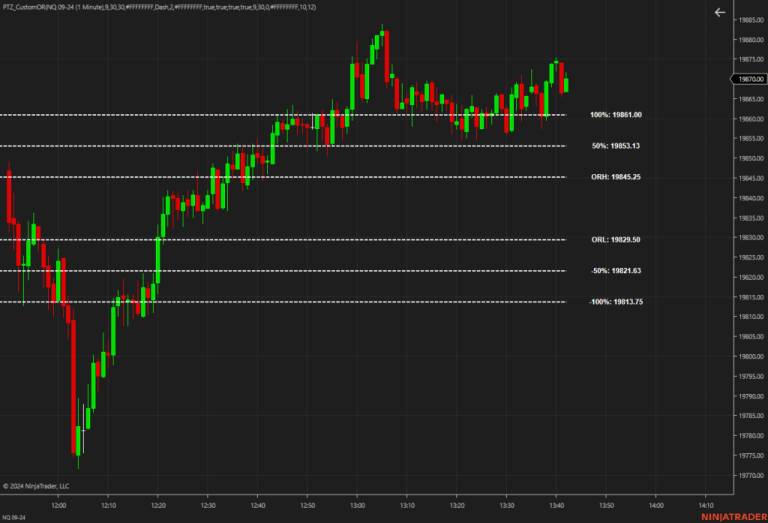
Custom Opening Range -30sec
PTZ_CustomOR Indicator for NinjaTrader The PTZ_CustomOR is a powerful and customizable opening range (OR) indicator designed for NinjaTrader. This indicator allows traders to define a custom opening range based on user-specified start and end times, using a secondary 30-second data series to ensure precision across various timeframes. Key features include: Customizable Opening Range: Define the ORH (Opening Range High) and ORL (Opening Range Low) with adjustable start and end times minimum be the 30 sec CME Opening Range. Extension Levels: Automatically plots 50% and 100% extension levels above and below the opening range, providing key price levels for potential breakout and pullback opportunities. Visual Customization: Tailor the indicator to your…
-
PTZ Wave
The PTZ Wave indicator leverages historical price data to plot Exponential Moving Averages (EMAs) in real-time. It calculates two sets of EMAs (fast and slow) to create a series of wave plots. 1. Historical Data Analysis: The indicator utilizes historical price data to initialize EMA values, ensuring accurate wave patterns from the start. 2. EMA Calculation: It calculates the fast EMA using a specified period (default is 5). The slow EMA is then calculated from the fast EMA. This dual EMA setup helps capture short-term and long-term trends. 3. Real-Time Plotting: As new price data arrives, the indicator updates the EMA values and plots the waves in real-time, reflecting current…
-
Trade Detector Indicator Free
Key Features The Trade Detector indicator offers several customizable features to suit your trading needs: Transaction Volume Threshold: Specify the minimum volume for a transaction to be considered significant. Time Interval: Set the maximum allowable time gap between consecutive transactions to detect rapid, large trades. Visual Alerts: Customize dot colors and line colors for buy and sell transactions. Sound Alerts: Configure different sound alerts for buy and sell transactions. Text Display: Choose to display the transaction time or volume directly on your chart. How It Works The Trade Detector indicator analyzes transaction data in real-time to identify large trades that meet your specified criteria. Here’s a detailed breakdown of how…
-
PTZ Linear Regression Channel Free
PTZ Linear Regression Channel Indicator Overview: The PTZ Linear Regression Channel Indicator is a powerful tool for traders utilizing the NinjaTrader platform. This indicator helps you visualize the trend and potential reversal points by plotting a linear regression channel on your price chart. It includes customizable bands based on standard deviations, allowing for a tailored analysis to suit your trading strategy. Features: Linear Regression Line: Plots the main regression line based on the specified period. Customizable Period: Adjust the number of bars used for the calculation to fine-tune the regression line. Standard Deviation Bands: Includes two customizable bands that represent standard deviations from the main regression line, aiding in identifying…
-
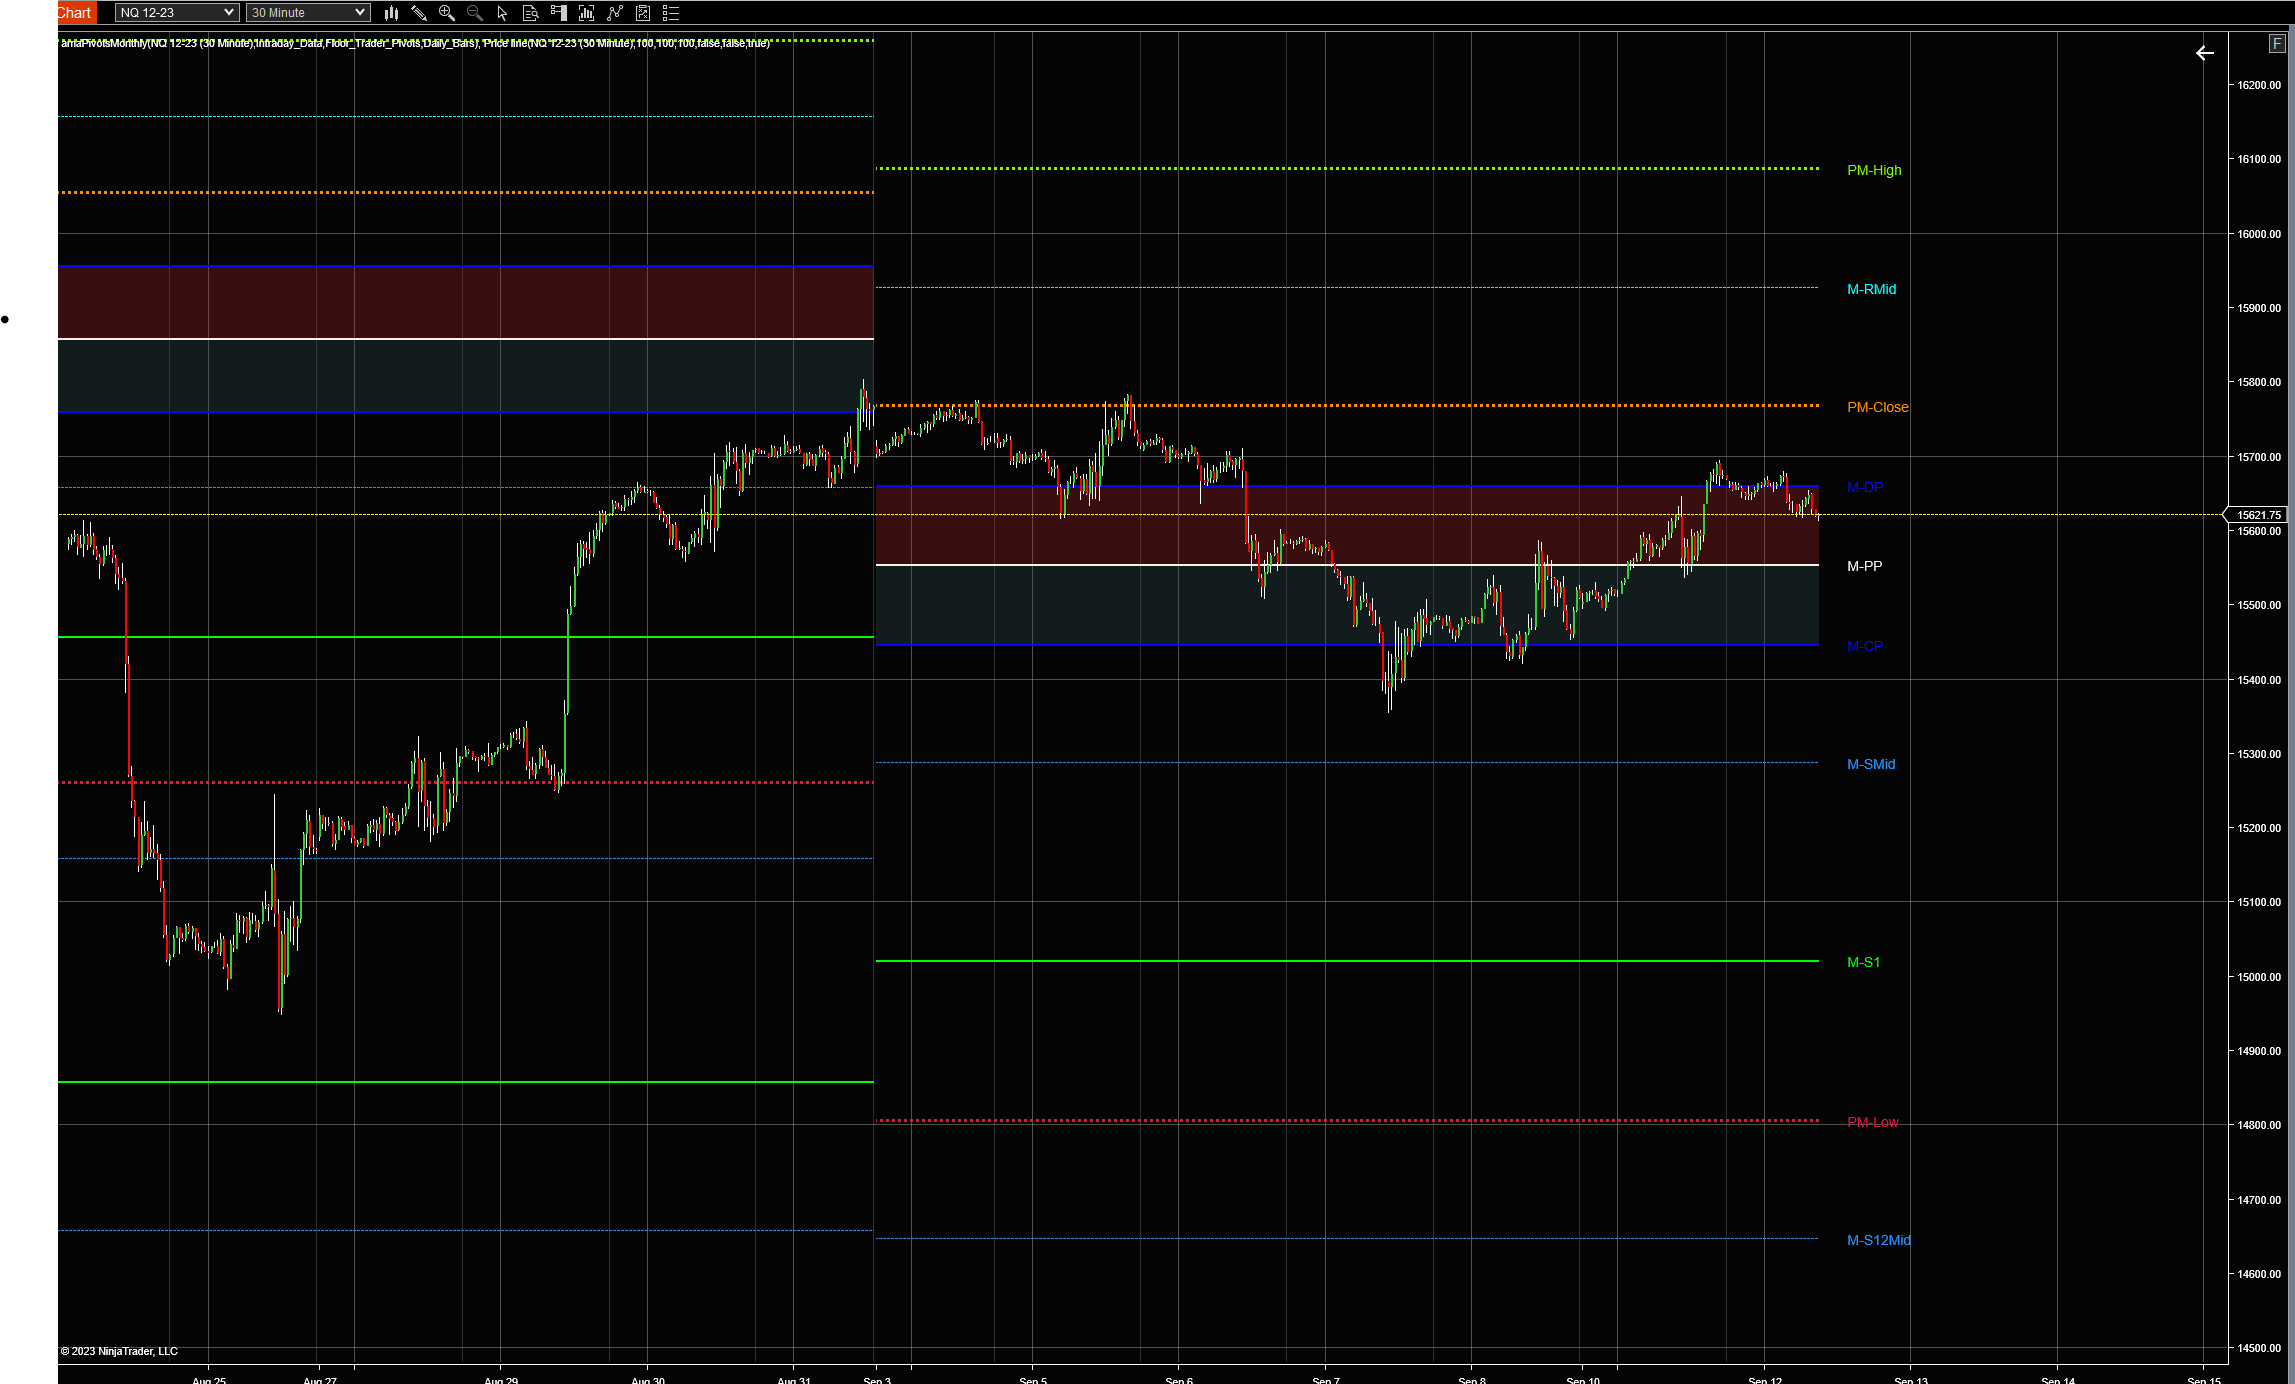
Average Daily Range ADR Levels
IMPORTANT: Read Before Installing The Average Daily Range Levels indicator is essential for displaying the daily price range on your trading screen, along with projected extensions of that range as the day progresses. Note that to compute an ADR, you must have data for at least as many days as the ADR period you set; this should include weekends, which may lack data. For example, to display a 14-day ADR, ensure you have data for at least 14 actual trading days. Features of the ADR Indicator: Real-Time Updates: The indicator updates live with each price tick. Projection Lines: These are not predictions but are calculated by adding or subtracting the…
-
Trend QQE Free
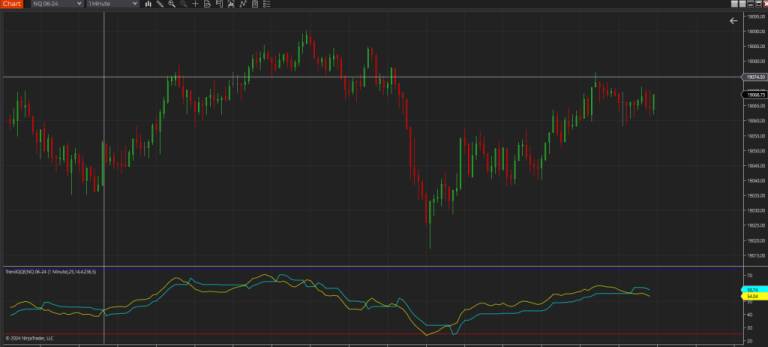
Trend QQE FREE Quantitative Qualitative Estimation (QQE) indicator is a smoother version of the popular Relative Strength Index (RSI) indicator with a volatility based trailing line that gives you momentum crossovers and confirmations. Input Parameters are: RSI Period : Default setting is 14 SF , smoothing factor : Default setting is 5 QQE coefficient : Default setting is 4.236 , one of most used percentage ratios based on the Fibonacci sequence OversoldLevel : Default setting is 30. If this is set to 30, overbought level is automatically set to 100-30 = 70 on the chart Plots two lines: – QQE , Yellow line – Trail , Cyan line Coded by…
-
Leg Counter
Leg Counter Free Indicator The Simple Leg Counter is used to count the pullbacks in a trend. A new trend will start at zero then begin counting every pull back until there is a reset. For example, an uptrend will begin at zero and the indicator will label each found pullback until a lower high is printed. Equal highs or equal lows will not reset the counter. Note that the indicator will recognized 1, 2 and 3 sequential equal high/low bars. It does not currently recognize more than 3 sequential equal bars. Basic font features can be changed such as the color, family, size etc. The margin from the tops/bottoms…
-
Free Zoom Chart Indicator
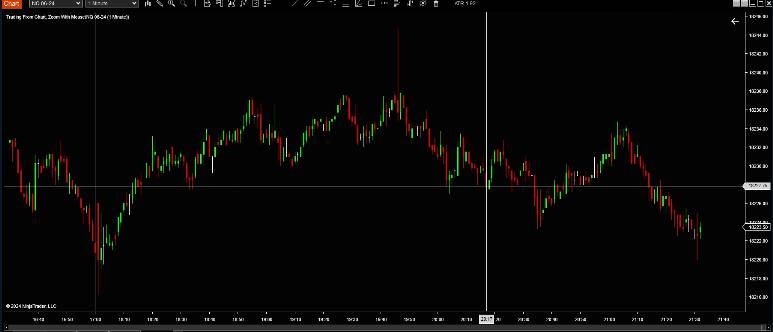
ZoomChart The Free Zoom Chart Indicator that enables one to zoom the chart by holding the CTRL key in combination with the mouse wheel Requirements NinjaTrader 8 Installation Download the ZoomChart.zip file In NinjaTrader go to Tools -> Import -> NinjaScript Add-On and select the downloaded ZIP file Right click on a chart, select Indicators… and find Zoom With Mouse in the list of indicators Usage Hold the left or right CTRL key and use the mouse wheel to zoom the chart
-
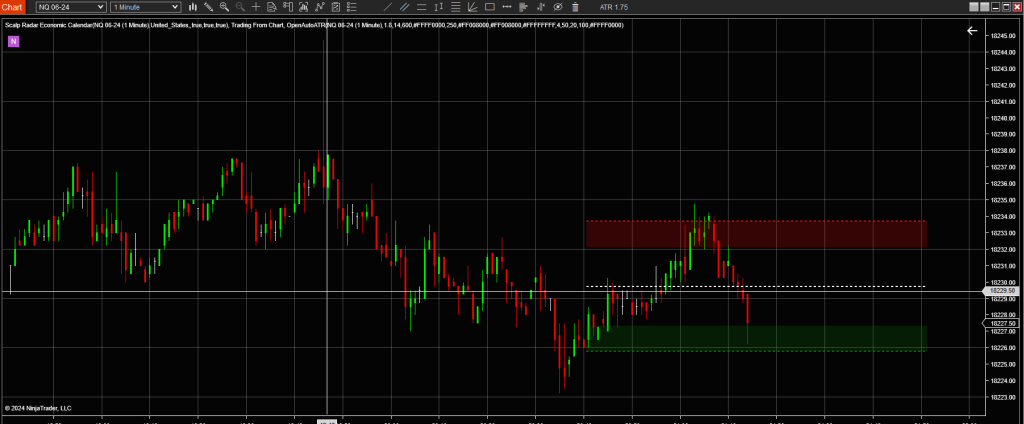
Free Auto ATR
– Free Open Auto ATR displays the median ATR for the last Median Period. It will auto-update once the high or low of the median ATR breaks. The idea is to play the range or break out and help increase risk/reward ratios. The full source can be viewed on GitHub. https://github.com/WaleeTheRobot/open-auto-atr This is an indicator that auto-updates the median Average True Range. Trade Ideas – Use the high, low, or median lines as targets or stops – Play reversion from the upper and lower ranges – Play breakouts from high and low Properties – ATR – The ATR period. – ATR Multiplier – The multiplier is used with the ATR…