-
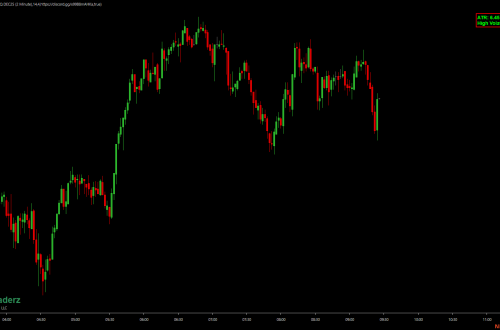
Trade From Chart Free Indicator
The Trade From Chart indicator for NT8 allows placing orders with a keyboard + mouse combination on a NinjaTrader chart, without having to use NinjaTrader’s fiddly right-click menu. Select from indicator properties what key you want to use plus mouse click You can select from the left side of the keyboard or the right side of the keyboard the Shift or Alt key plus mouse click You can find the author of this code here https://github.com/DominikBritz
-
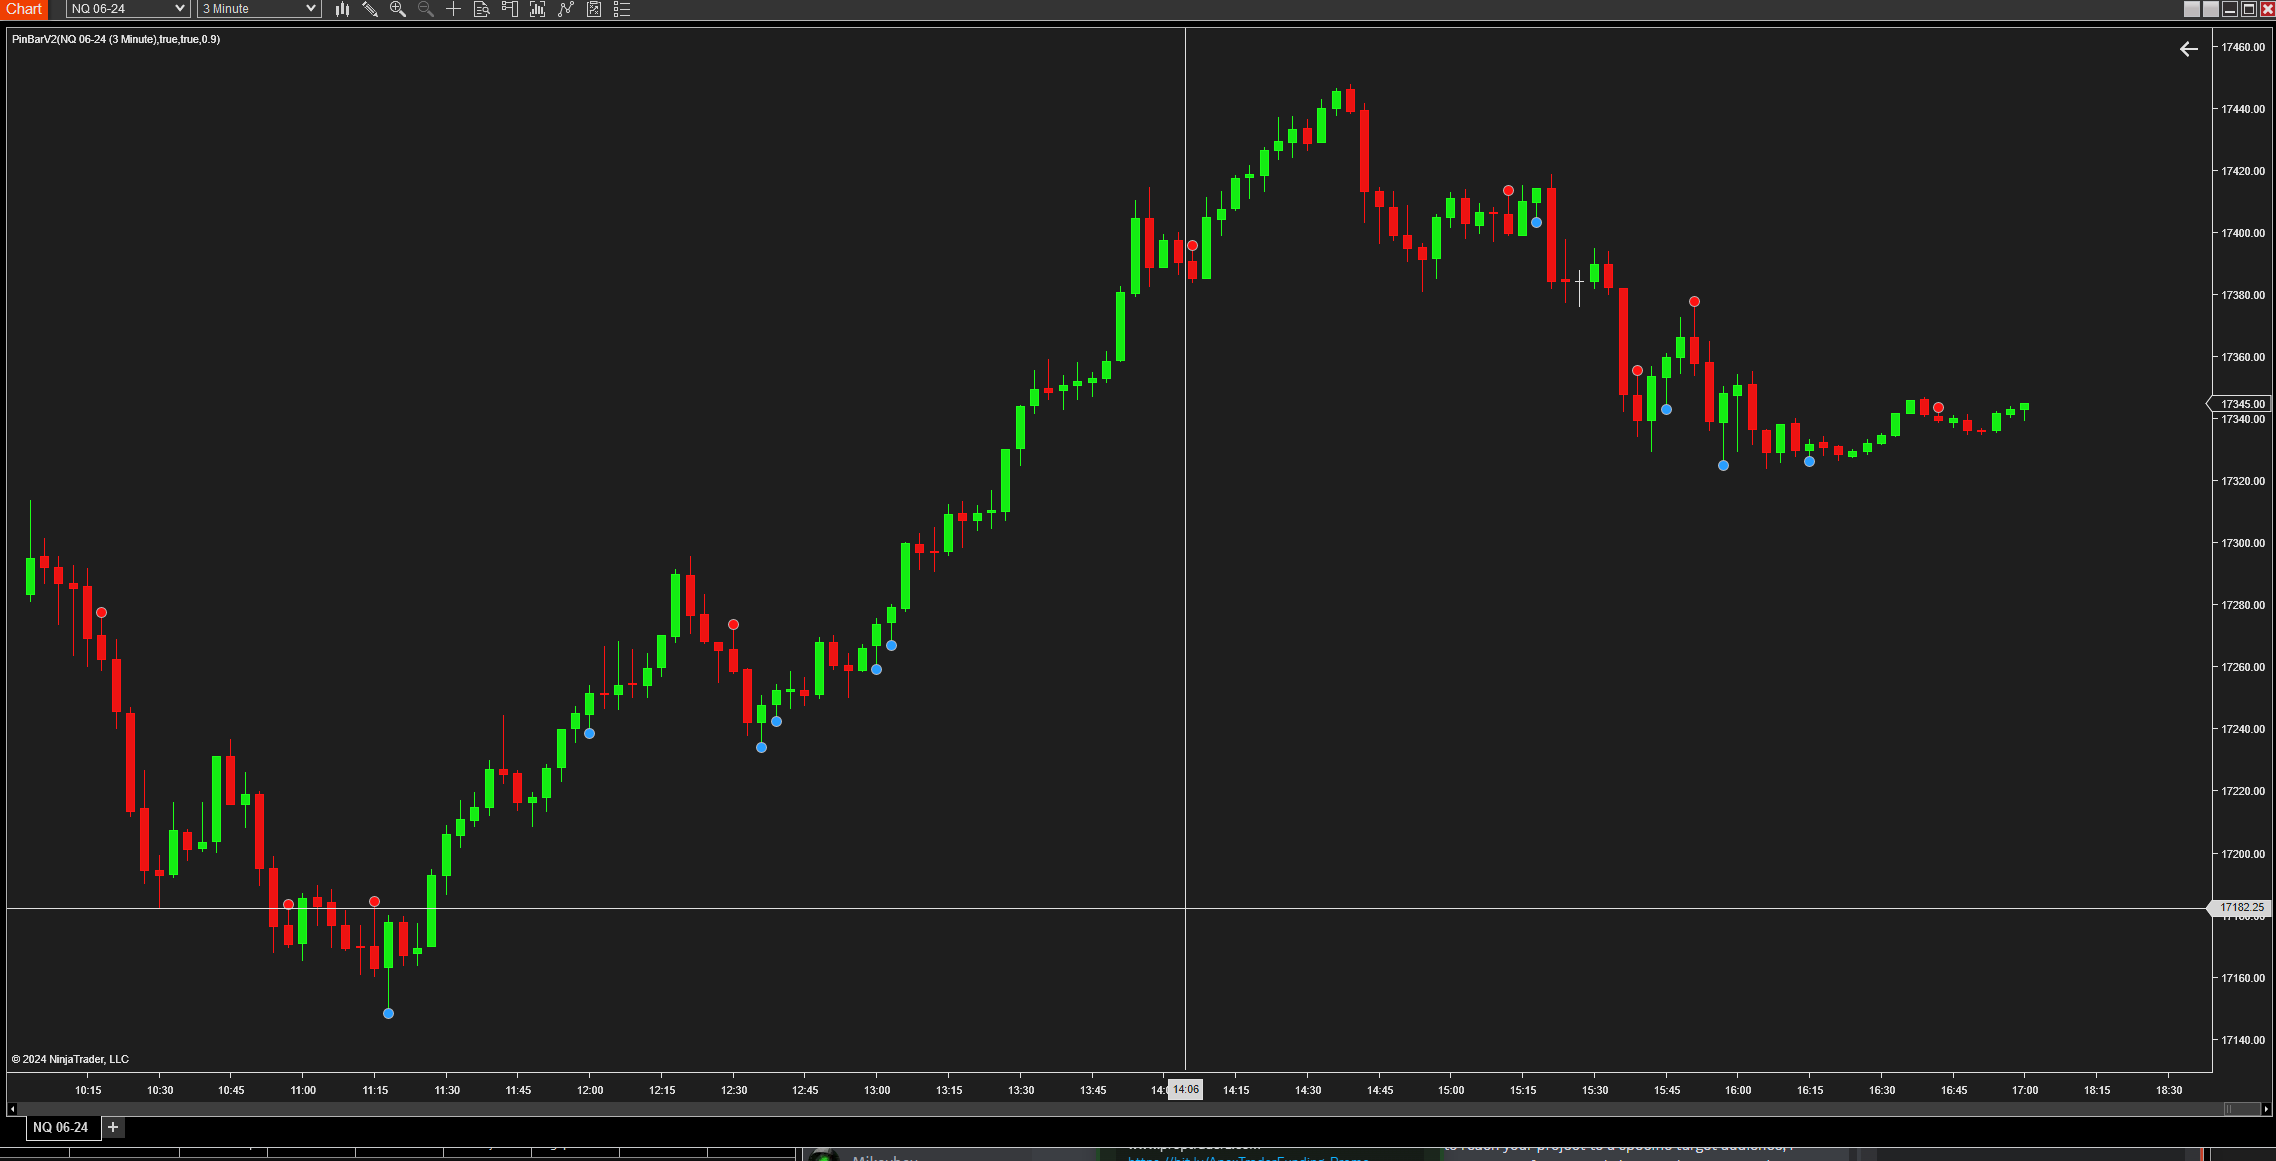
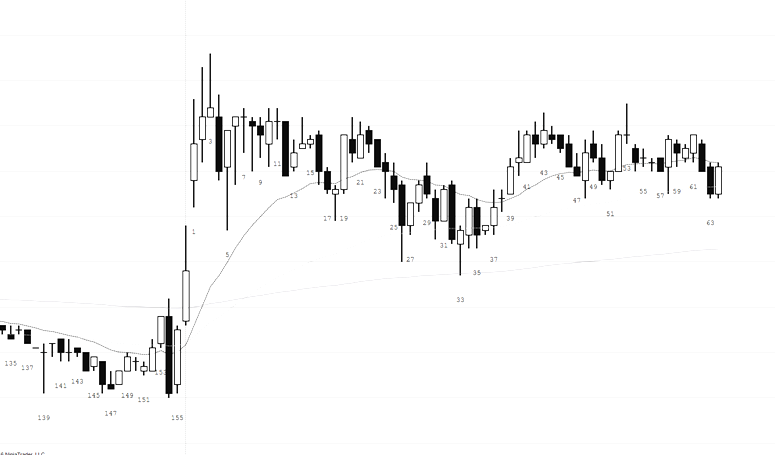
Pin Bar Free Indicator
Pin Bar Indicator for NinjaTrader The Pin Bar Free Indicator is a robust tool designed for the NinjaTrader platform that identifies pin bar formations, which are key signals of potential market reversals. This indicator detects both bullish and bearish pin bars, offering traders a powerful method to spot high probability entry and exit points based on price action. Features: – Automatic Detection: Scans charts in real-time to identify the formation of bullish and bearish pin bars. – Customizable Sensitivity: Features an adjustable threshold multiplier that allows traders to set the sensitivity of pin bar detection, catering to both conservative and aggressive trading styles. – Visual Alerts: Marks identified pin bars…
-
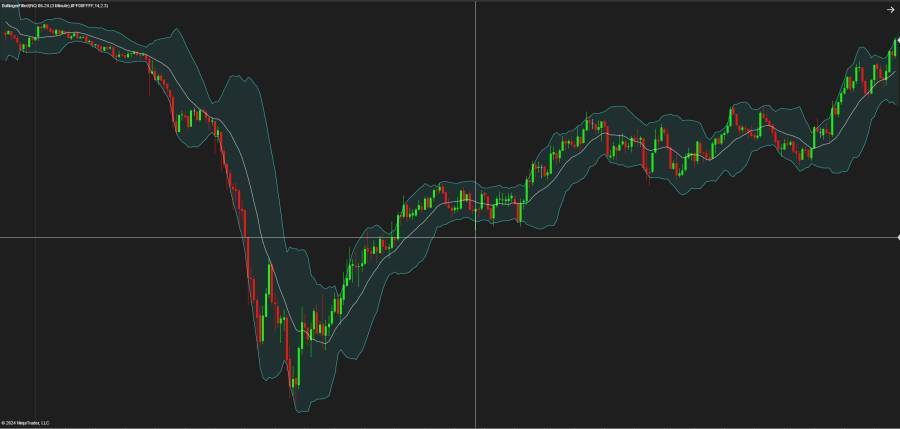
Bollinger Filled Bands
Bollinger Band with filled area between upper and lower Bands Bollinger Bands are plotted at standard deviation levels above and below a moving average. Since standard deviation is a measure of volatility, the bands are self-adjusting. Widening during volatile markets and contracting during calmer periods. The upper and lower bands are set to transparent by default. You can choose any color you want.
-
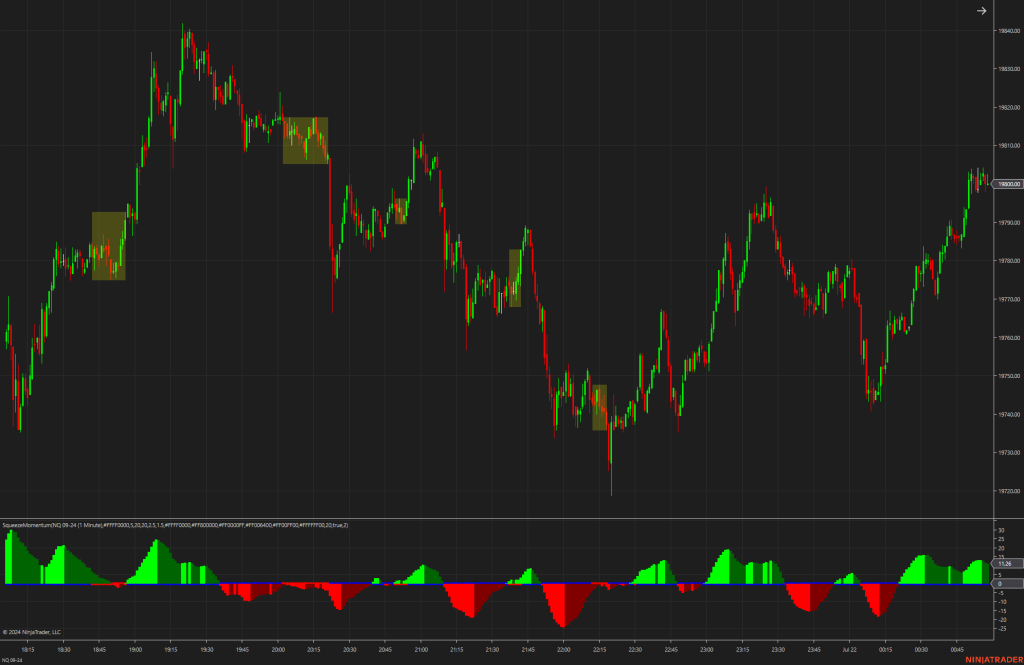
Squeeze Momentum
The Squeeze Momentum indicator is a tool that aims to help traders spot and capitalize on market “squeeze” situations, which often precede significant price movements. It uses a combination of Average True Range (ATR) and standard deviation calculations to identify when the market is in a squeeze—indicated by a period of lower volatility—and prepares traders for potential breakouts. With customizable settings for visual alerts and volatility boxes, it enhances the charting experience by highlighting crucial trading ranges. This indicator is suitable for traders who follow the Bollinger Bands and Keltner Channels strategies and are looking for a visual edge in their trading setup.
-
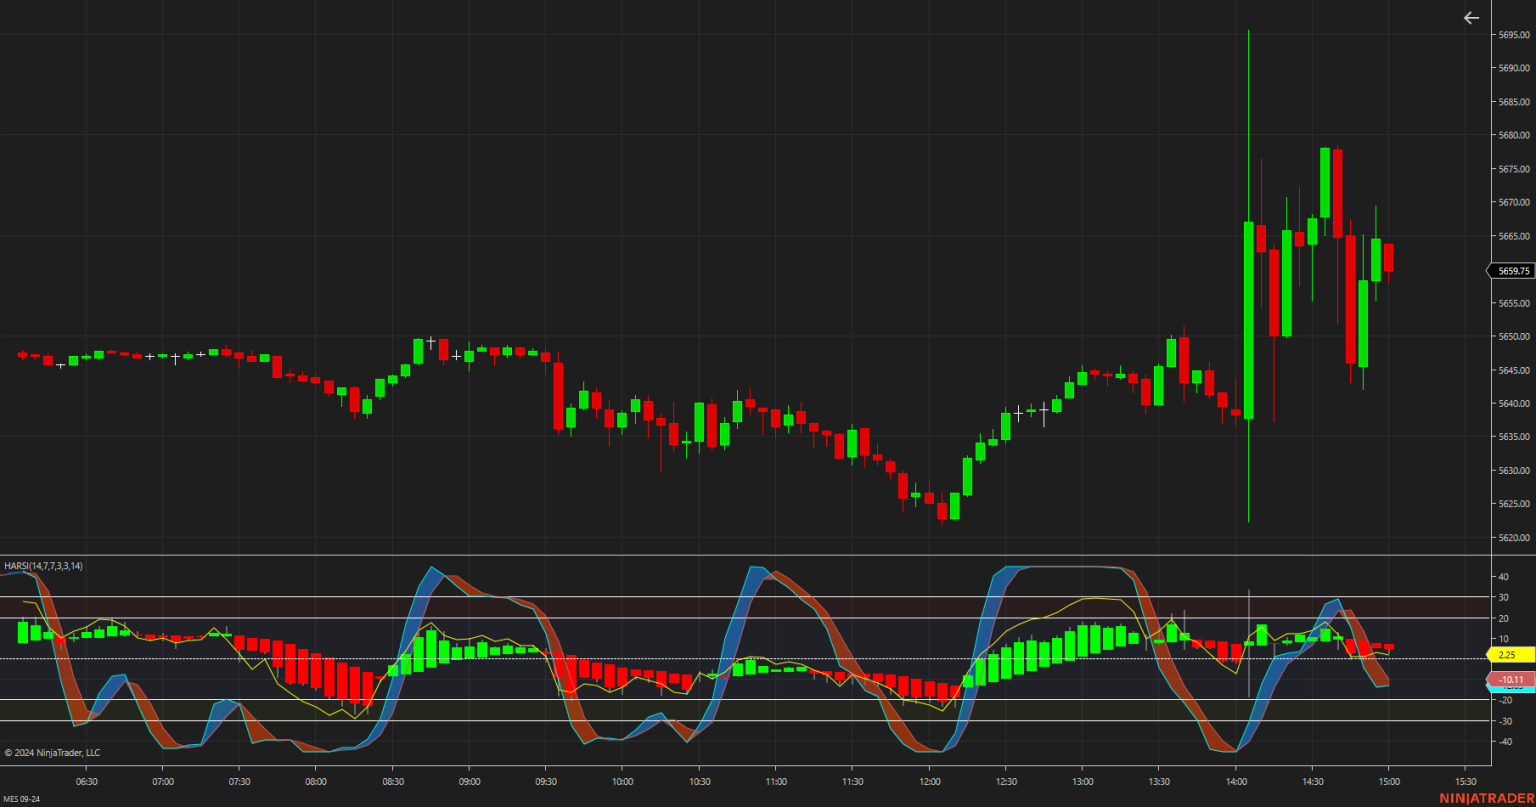
AbsoluteStrengthV1 -Free Add-On NT8
AbsoluteStrengthV1 -Free Add-On NT8 How it Works: At its core, the AbsoluteStrengthV1 indicator distinguishes between bullish and bearish market forces by measuring their absolute strength. Traders can select between two calculation methods: the RSI Method, which reflects the traditional Relative Strength Index, and the Stoch Method, inspired by Stochastic calculations. Adaptability and Customization: Adaptability is one of the standout features of AbsoluteStrengthV1 The indicator allows users to choose from six different types of moving averages, including Simple (SMA), Exponential (EMA), and more specialized ones like Hull (HMA) and Zero-Lag Exponential (ZLEMA). This level of customization ensures that traders can tailor the indicator to fit their unique trading strategies and market…
-
Free Custom Volume -NinjaTrader8
The Free Custom Volume Indicator for NinjaTrader displays volume activity with distinct colors for rising and falling volume bars. It enhances visual analysis by coloring bars green for ‘up’ volume where activity is above a specified threshold and red for ‘down’ volume below it. Additionally, the indicator includes a moving average line for volume, providing a clear reference point for identifying trends and potential reversals in market sentiment based on trading volume.
-
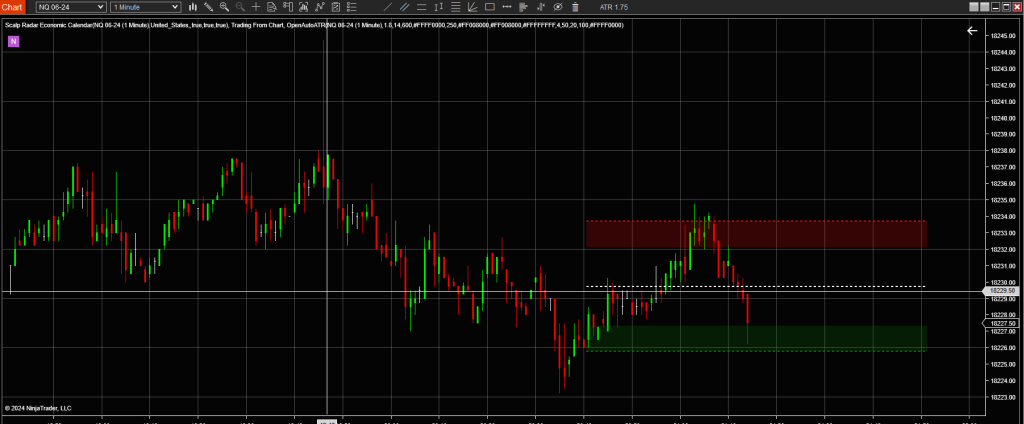
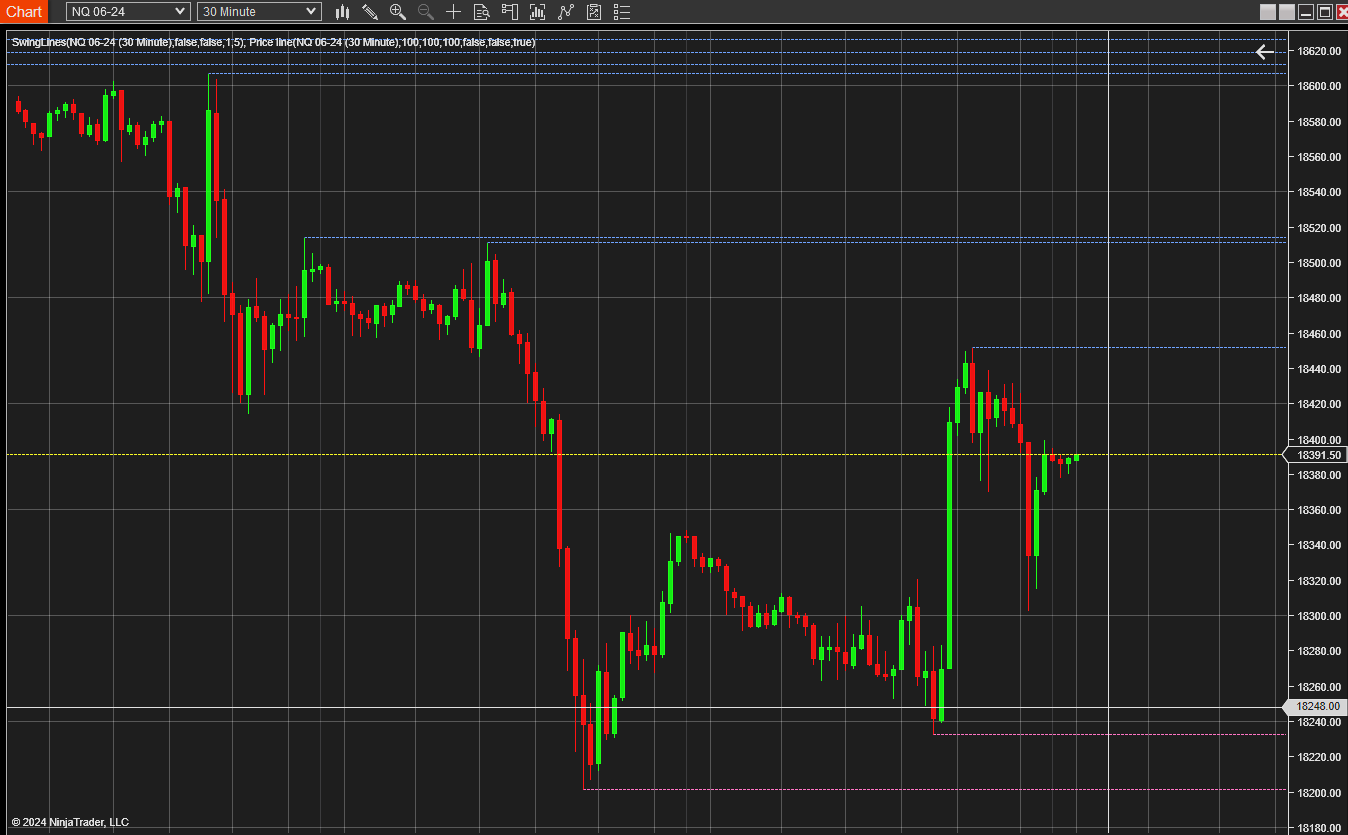
Swing Lines Add-on for NinjaTrader8
The Swing Lines Add-on for NinjaTrader8 plots lines extending from swing points to the right edge of the chart and will issue alerts when price crosses these lines. There is also an option to retain these lines after they’ve been breached by the price. Be aware that enabling the “keep broken lines” feature can result in numerous lines being drawn on the chart; therefore, it is turned off by default for clarity. With the Swing Lines Add-on for NinjaTrader8 you have the flexibility to customize the color of the swing lines and the alert sounds to suit your preferences. Both visual and audio alerts can be activated to notify you…
-
High/Low Envelope
High/Low Envelope Download Introducing the High/Low Envelope Indicator You can find some other free products like the High/Low Envelope also at www.scalpradar.com The High/Low Envelope, a dynamic tool plots the highest and lowest prices reached within a specified number of periods, offering insights into price movements. With default settings analyzing 14 periods, you have the flexibility to adjust properties to suit your preferences. Customize line style and colour, The possibility to choose to plot only high, low, or both, ensuring a tailored experience. Whether you’re identifying support/resistance levels or anticipating breakouts, this indicator provides clarity and precision. Easily navigate parameter settings to fine-tune your analysis. Enhance your trading strategy with…
-
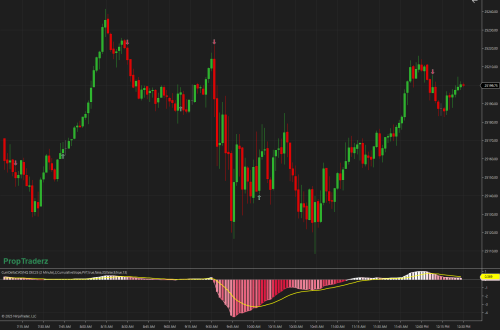
Bollinger Width
Bollinger Width The Bollinger Width Indicator is a technical analysis tool that can provide unique insights into market volatility. Derived from the Bollinger Bands, which consist of a moving average and two standard deviation lines (bands) above and below it, the Bollinger Band Width measures the distance, or width, between these bands. What is Bollinger Width? Bollinger Width quantifies the gap between the upper and lower Bollinger Bands. This gap widens with increasing market volatility and narrows during less volatile periods. It’s a simple metric calculated by subtracting the lower band from the upper band and can often be represented as a separate chart below the main price chart. Significance in Trading…
-
Market Wizards – Jack D. Schwager
Jack D. Schwager’s Market Wizards series stands as a beacon of insight and wisdom in the world of trading. With each edition, Schwager invites readers into the minds of the market’s most successful traders, offering invaluable lessons and strategies for navigating the complexities of financial markets. Through candid interviews and profound analysis, ‘Market Wizards’ equips traders with the knowledge and inspiration needed to thrive in ever-changing market conditions. From legendary investors to hedge fund managers, Schwager’s series illuminates the diverse paths to trading success, making it an essential read for traders of all levels. Full Series