-
Replikanto Flow Bots-NT Copy Trader
Replikanto Flow Bots: Replikanto Flow Bots: Leveraging Multiple Accounts with the Help of a Copy Trader Replikanto Flow Bots-NT Copy Trader As a trader, you may have multiple accounts in different brokerages or platforms. Managing all of them can be a hassle, and manually placing trades on each account can be time-consuming. This is where Replikanto Flow Bots come in handy. A 10% discount from Replikanto with the code PROPTRADERZ10 Update for Black Friday -40% off code PROPTRADERZ40Black Replikanto Flow Bots are automated trading tools that allow you to copy trades between multiple accounts in real time. This means that when you place a trade on one account, the…
-
Understanding Futures: An Introduction to Trading Contracts for Market Participants
Understanding Futures Contracts: Beginner’s Guide Article Overview New to futures or looking for a refresher? This article is designed for you. Dive into the basics of futures contracts, how contracts trade on a futures exchange, the different ways customers use these instruments and the benefits that futures provide. Gain a stronger understanding of how futures work and why more market participants are using derivatives in their trading strategies today. This course covers: – Contract Specifications – Contract Trading Codes – Expiration and Settlement Processes – Tick movements – Futures Price Limits – Notional Value – Futures Market Transparency – Margin – Roles of Speculators and Hedgers What is a Futures…
-
Market Structure Course
Market Structure In this article, we will understand the following pointers. 1. What is the Market Structure in Trading? 2. Principles of Market Structure 3. Elements of the Market Structure What is Market Structure in Trading? – Market structure gives us bias for trading opportunities. In the bull market, we always look to buy dips – Range market we look for buy low sell high Principles of Market Structure (here good indicator ) Price moves within a structure of support and resistance.(FVG plus indicator here ) A breakout of the structure of support or resistance will lead to price movement in the next area of support or resistance. A breakout…
-
Harmonic Patterns- Scalper
Harmonic Patterns Harmonic patterns are a popular tool used by traders to identify potential reversal points in the market. These patterns are based on a series of Fibonacci retracements and extensions, which are derived from the golden ratio, a mathematical ratio found throughout nature. While the Gartley, Butterfly, and Crab patterns are commonly known harmonic patterns, there are alternative harmonic patterns traders can use to identify profitable trades. Harmonic Patterns can be very hard to spot and Automate in your trading Strategy. This indicator will magically spot for you the various patterns and enables you to use it in an Automated strategy and back-test its performance! This Indicator Detects 8…
-
Market Structure – Order Blocks and FVG-ICT
Market structure Market structure is a critical concept in trading and investing. Understanding market structure can help traders and investors make more informed decisions and improve their overall performance. In this article, we will explore what market structure is, why it matters, and how it can be analyzed. What is Market Structure? Market structure refers to the way in which a market is organized, including its participants, trading rules, and the types of securities being traded. It can be thought of as the “framework” within which trading activity takes place. Market structure can vary depending on the type of security being traded, the exchange on which it is traded, and…
-
The Disciplined Trader- Mark Douglas
The Disciplined Trader- Mark Douglas- Developing Winning Attitudes The Disciplined Trader- Mark Douglas’s classic book that introduced the investment industry to the concept of trading psychology. With rare insight based on his firsthand commodity trading experience, author Mark Douglas demonstrates how the mental matters that allow us to function effectively in society are often psychological barriers in trading. After examining how we develop losing attitudes, this book prepares you for a thorough “mental housecleaning” of deeply rooted thought processes. And then it shows the reader how to create and apply attitudes and behaviours that transcend psychological obstacles and lead to success. The Disciplined Trader helps you join the elite few…
-
PriceActionSwing
This indicator for NinjaTrader 8.0 calculates swings in different ways and visualizes them. It shows swing information like the swing length, duration, volume, etc. It contains a lot of features and it is useable in the Market Analyzer. Strategies based on older PriceActionSwing versions will not work with this update. Remove old PriceActionSwing versions (do a backup first) before you import the updated version. The package contains two indicators: PriceActionSwingPro – Swing indicator with visualization and swing information – ABC patterns – Compute divergences based on different indicators – Naked swing lines – Swing statistics – Draw Fibonacci extensions and retracements automatically PriceActionSwingOscillator – Swing trend and relation visualization –…
-
DynamicSRLines
This indicator draws horizontal Support/Resistance lines at various price levels, above and below the market, where price historically created swing High/Low pivots multiple times, creating support and resistance as price action bounced off of those levels. Created By NinjaTrader_JoshG NinjaTrader Version 8 File Size 3.2 KB Create Date 01/19/2018 # of Downloads 8344 and counting
-
Initial Balance Indicator
The initial balance refers to the price range and trading volume of the first few minutes of a trading session. The initial balance is often used as a reference point for traders to determine the market trend and to develop trading strategies for the rest of the session. The Initial Balance strategy involves placing trades based on the market’s direction after the initial balance period has ended. The Initial Balance period typically lasts for the first 30 minutes to 1 hour of a trading session, during which the market is usually the most volatile. Traders often use this time to assess the market and establish the direction of the trend.…
-
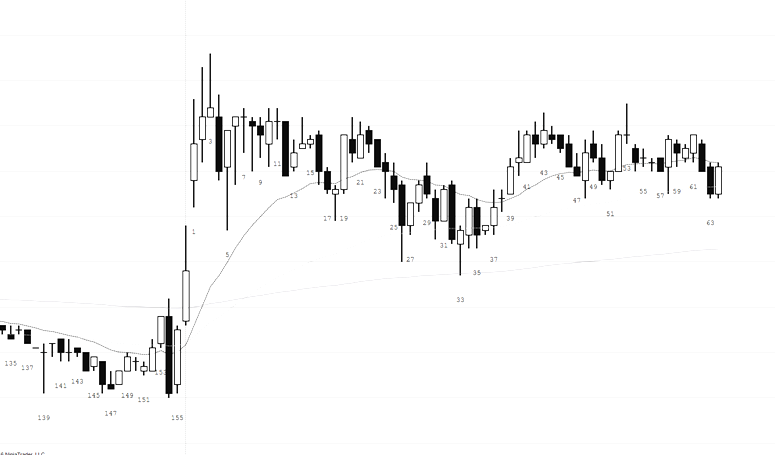
The Inside Bar Candlestick Pattern
The inside bar candlestick pattern The inside bar candlestick pattern is one of the most potent chart setups that professional traders lookout; however, most traders fail to trade it successfully. Lack of skills and knowledge and poor education are the primary reasons why most price action traders don’t make money trading this Japanese candlestick. Tips for Trading the Inside Bar Pattern 1. Use the Inside Bar pattern in conjunction with other technical analysis tools such as trendlines, support and resistance levels, and indicators to confirm the direction of the trend and increase the probability of a successful trade. 2. Pay attention to the size of the Inside Bar compared to…
You May Also Like

The Sine Wave Indicator-John Ehlers

Trade From Chart Free Indicator

TrendScalperV1