-
Historical Price Projection-Lux Algo Free
The Historical Price Projection tool aims to project future price behavior based on historical price behavior plus a user defined growth factor.The main feature of this tool is to plot a future price forecast with a surrounding area that exactly matches the price behavior of the selected period, with or without added drift. Other features of the tool Historical Price Projection-Lux Algo include: – User-selected period up to 500 bars anywhere on the chart within 5000 bars User selected growth factor from 0 (no growth) to 100, this is the percentage of drift to be used in the forecast.- – User selected area wide – Show/hide forecast area Settings Data Gathering…
You May Also Like

PTZ_ScalpTraderV1 Indicator Free

FootPrintV2 Chart for NT8
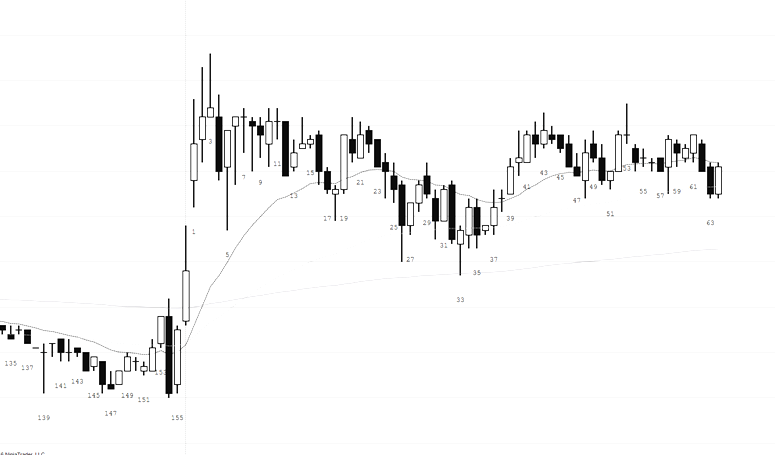
Bar Counter-NinjaTrader
-
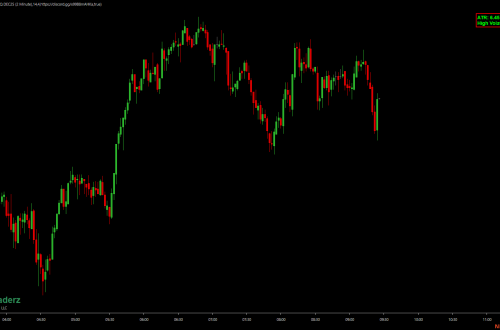
NADARAYA WATSON ENVELOPE -Lux Algo Repaints NT8
The NADARAYA WATSON ENVELOPE -Lux Algo Repaints NT8 Indicator for NinjaTrader8 is a technical analysis tool used in trading to estimate a smoothed price curve based on kernel regression. It is an extension of the Nadaraya-Watson estimator, which is a non-parametric regression technique. The envelope forms upper and lower bands around the price, helping traders identify potential support and resistance levels. Key Features: – Kernel Regression: The Nadaraya-Watson estimator uses kernel functions to smooth price data, giving a more accurate reflection of price trends compared to simple moving averages. – Upper and Lower Envelopes: The bands are calculated as deviations from the smoothed price curve, similar to how Bollinger Bands…
-
PTZ_ScalpTraderV1 Indicator Free
Overview of PTZ_ScalpTradeV1 The PTZ_ScalpTraderV1 indicator works by plotting three moving averages on your chart: two fast-moving averages and one trend-moving average. It also highlights the area between the two fast-moving averages as a “tunnel.” The indicator generates buy and sell signals based on the relationship between the price and these moving averages, helping traders identify potential trading opportunities in trending markets. By default, the indicator has the values I use. The best time frame I found to be is 3 Min charts. Works well also on other charts, like Renko, Tick,etc Avoid taking signals long if the cloud is hiding down, or short when the cloud still hiding up.…
-
LSMA SLOPE – Least Square Moving Average
Least Squares Moving Average (LSMA) The Least Squares Moving Average (LSMA) is a powerful tool for analyzing price trends in financial markets. Unlike traditional moving averages, the LSMA is based on a linear regression line that minimizes the squared differences between observed and predicted values, making it highly responsive to market conditions. In this article, we’ll explore what the LSMA is, how it works, and how an advanced indicator like the LSMA Slope with Offset can enhance trading strategies. What is the LSMA? The LSMA is a type of moving average that calculates the best-fit line through a set of data points, using a linear regression model. The line is…
-
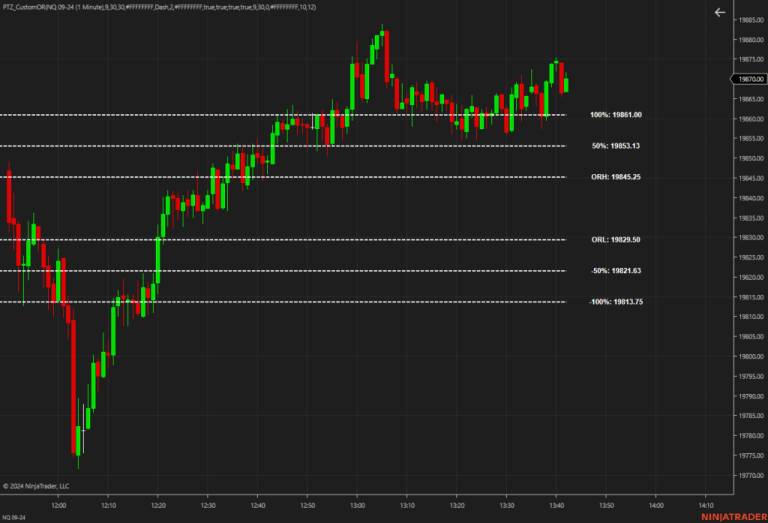
Custom Opening Range -30sec
PTZ_CustomOR Indicator for NinjaTrader The PTZ_CustomOR is a powerful and customizable opening range (OR) indicator designed for NinjaTrader. This indicator allows traders to define a custom opening range based on user-specified start and end times, using a secondary 30-second data series to ensure precision across various timeframes. Key features include: Customizable Opening Range: Define the ORH (Opening Range High) and ORL (Opening Range Low) with adjustable start and end times minimum be the 30 sec CME Opening Range. Extension Levels: Automatically plots 50% and 100% extension levels above and below the opening range, providing key price levels for potential breakout and pullback opportunities. Visual Customization: Tailor the indicator to your…
-
PTZ Wave
The PTZ Wave indicator leverages historical price data to plot Exponential Moving Averages (EMAs) in real-time. It calculates two sets of EMAs (fast and slow) to create a series of wave plots. 1. Historical Data Analysis: The indicator utilizes historical price data to initialize EMA values, ensuring accurate wave patterns from the start. 2. EMA Calculation: It calculates the fast EMA using a specified period (default is 5). The slow EMA is then calculated from the fast EMA. This dual EMA setup helps capture short-term and long-term trends. 3. Real-Time Plotting: As new price data arrives, the indicator updates the EMA values and plots the waves in real-time, reflecting current…
-
Trade Detector Indicator Free
Key Features The Trade Detector indicator offers several customizable features to suit your trading needs: Transaction Volume Threshold: Specify the minimum volume for a transaction to be considered significant. Time Interval: Set the maximum allowable time gap between consecutive transactions to detect rapid, large trades. Visual Alerts: Customize dot colors and line colors for buy and sell transactions. Sound Alerts: Configure different sound alerts for buy and sell transactions. Text Display: Choose to display the transaction time or volume directly on your chart. How It Works The Trade Detector indicator analyzes transaction data in real-time to identify large trades that meet your specified criteria. Here’s a detailed breakdown of how…
-
PTZ Linear Regression Channel Free
PTZ Linear Regression Channel Indicator Overview: The PTZ Linear Regression Channel Indicator is a powerful tool for traders utilizing the NinjaTrader platform. This indicator helps you visualize the trend and potential reversal points by plotting a linear regression channel on your price chart. It includes customizable bands based on standard deviations, allowing for a tailored analysis to suit your trading strategy. Features: Linear Regression Line: Plots the main regression line based on the specified period. Customizable Period: Adjust the number of bars used for the calculation to fine-tune the regression line. Standard Deviation Bands: Includes two customizable bands that represent standard deviations from the main regression line, aiding in identifying…
-
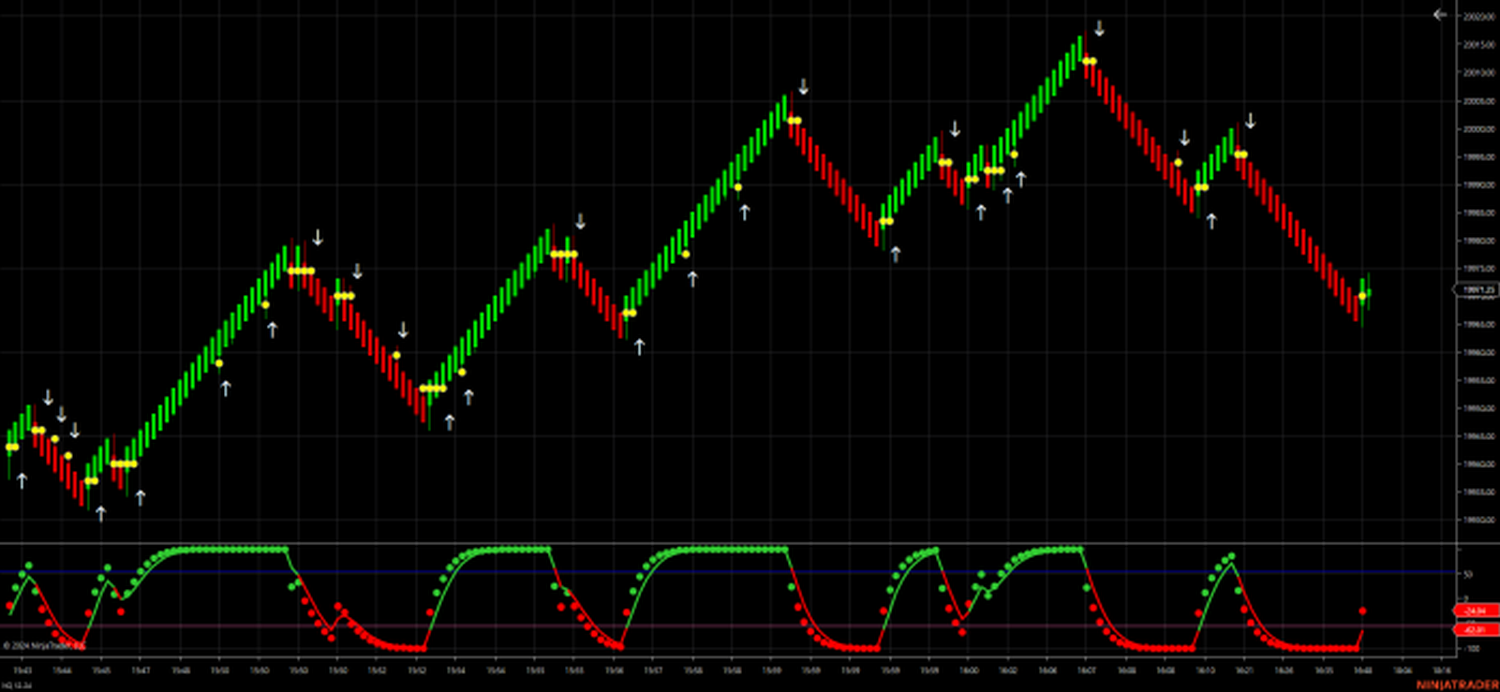
Market Reversal CBC_Signals
CBC_Signals Indicator The CBC _Signals indicator is a sophisticated trading tool designed to enhance your trading strategy by leveraging a Candle-by-Candle (CBC) flip approach. Originally developed by MapleStax, this indicator provides clear visual signals directly on your price chart, helping you make more informed trading decisions. Key Features: – Higher Time Frame Analysis: The indicator allows you to specify a higher time frame for signal generation, offering a broader perspective on market trends. – Visual Signals: It draws arrows on the chart to indicate potential long and short positions based on the specified conditions. – Integration: Seamlessly integrates with the NinjaTrader platform, providing an intuitive and user-friendly experience. How It…
-
Average Daily Range ADR Levels
IMPORTANT: Read Before Installing The Average Daily Range Levels indicator is essential for displaying the daily price range on your trading screen, along with projected extensions of that range as the day progresses. Note that to compute an ADR, you must have data for at least as many days as the ADR period you set; this should include weekends, which may lack data. For example, to display a 14-day ADR, ensure you have data for at least 14 actual trading days. Features of the ADR Indicator: Real-Time Updates: The indicator updates live with each price tick. Projection Lines: These are not predictions but are calculated by adding or subtracting the…