-
Gap Detector
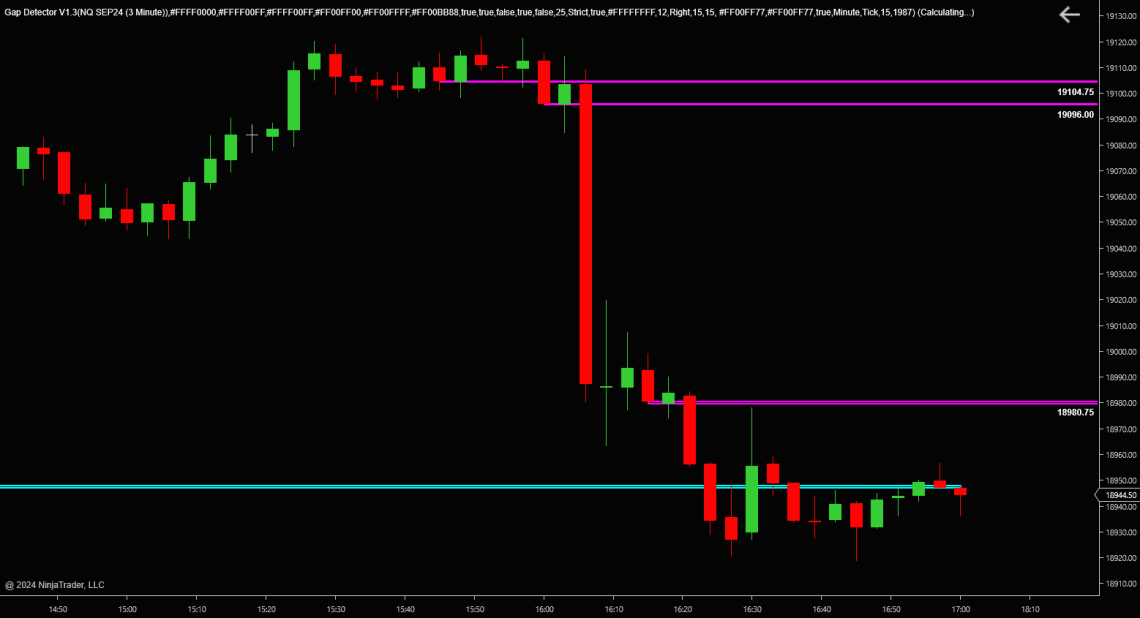
FreeIndicators – Gap Detector The GapDetector is a straightforward tool that shows where the market left unfinished business. It tracks two things: true session gaps and imbalance zones created by fast, one-sided moves. Session GapsWhen the market opens above or below the previous session’s close, the indicator marks the gap and extends it forward until price trades back through it. These areas often act as magnets or reaction points. Imbalance ZonesImbalances appear when price moves too quickly, leaving thin or inefficient trading behind. The indicator highlights these areas and keeps them active until the market revisits and fills them. You can run imbalances on multiple timeframes at the same…
-
Trend QQE Free
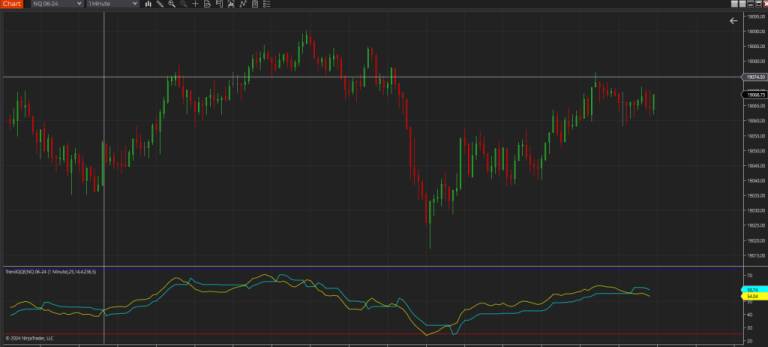
Trend QQE FREE Quantitative Qualitative Estimation (QQE) indicator is a smoother version of the popular Relative Strength Index (RSI) indicator with a volatility based trailing line that gives you momentum crossovers and confirmations. Input Parameters are: RSI Period : Default setting is 14 SF , smoothing factor : Default setting is 5 QQE coefficient : Default setting is 4.236 , one of most used percentage ratios based on the Fibonacci sequence OversoldLevel : Default setting is 30. If this is set to 30, overbought level is automatically set to 100-30 = 70 on the chart Plots two lines: – QQE , Yellow line – Trail , Cyan line Coded by…
-
Leg Counter
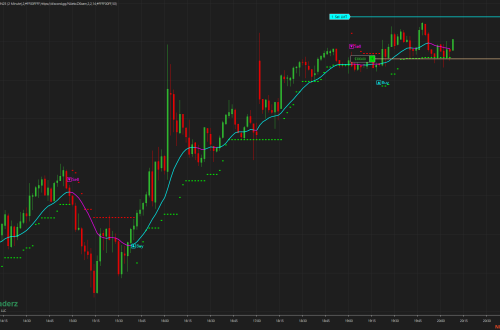
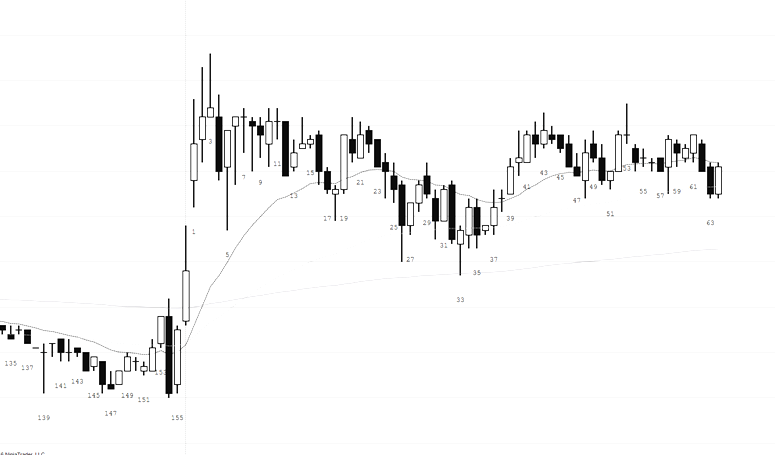
Leg Counter Free Indicator The Simple Leg Counter is used to count the pullbacks in a trend. A new trend will start at zero then begin counting every pull back until there is a reset. For example, an uptrend will begin at zero and the indicator will label each found pullback until a lower high is printed. Equal highs or equal lows will not reset the counter. Note that the indicator will recognized 1, 2 and 3 sequential equal high/low bars. It does not currently recognize more than 3 sequential equal bars. Basic font features can be changed such as the color, family, size etc. The margin from the tops/bottoms…
-
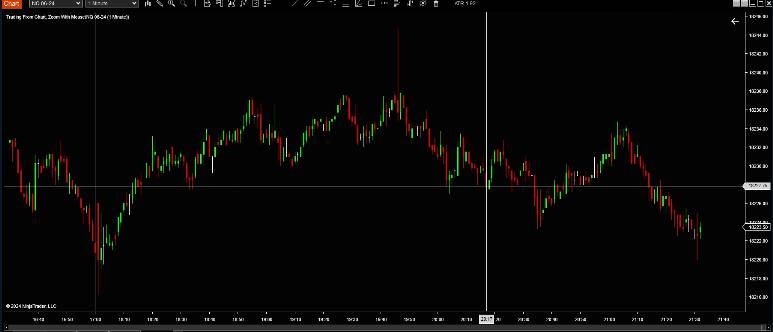
Free Zoom Chart Indicator
ZoomChart The Free Zoom Chart Indicator that enables one to zoom the chart by holding the CTRL key in combination with the mouse wheel Requirements NinjaTrader 8 Installation Download the ZoomChart.zip file In NinjaTrader go to Tools -> Import -> NinjaScript Add-On and select the downloaded ZIP file Right click on a chart, select Indicators… and find Zoom With Mouse in the list of indicators Usage Hold the left or right CTRL key and use the mouse wheel to zoom the chart
-
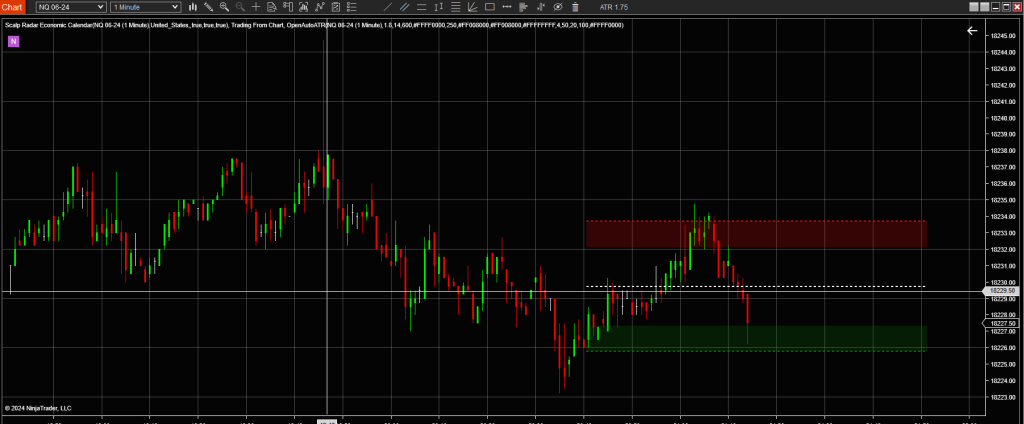
Free Auto ATR
– Free Open Auto ATR displays the median ATR for the last Median Period. It will auto-update once the high or low of the median ATR breaks. The idea is to play the range or break out and help increase risk/reward ratios. The full source can be viewed on GitHub. https://github.com/WaleeTheRobot/open-auto-atr This is an indicator that auto-updates the median Average True Range. Trade Ideas – Use the high, low, or median lines as targets or stops – Play reversion from the upper and lower ranges – Play breakouts from high and low Properties – ATR – The ATR period. – ATR Multiplier – The multiplier is used with the ATR…
-
Trade From Chart Free Indicator
The Trade From Chart indicator for NT8 allows placing orders with a keyboard + mouse combination on a NinjaTrader chart, without having to use NinjaTrader’s fiddly right-click menu. Select from indicator properties what key you want to use plus mouse click You can select from the left side of the keyboard or the right side of the keyboard the Shift or Alt key plus mouse click You can find the author of this code here https://github.com/DominikBritz
-
Pin Bar Free Indicator
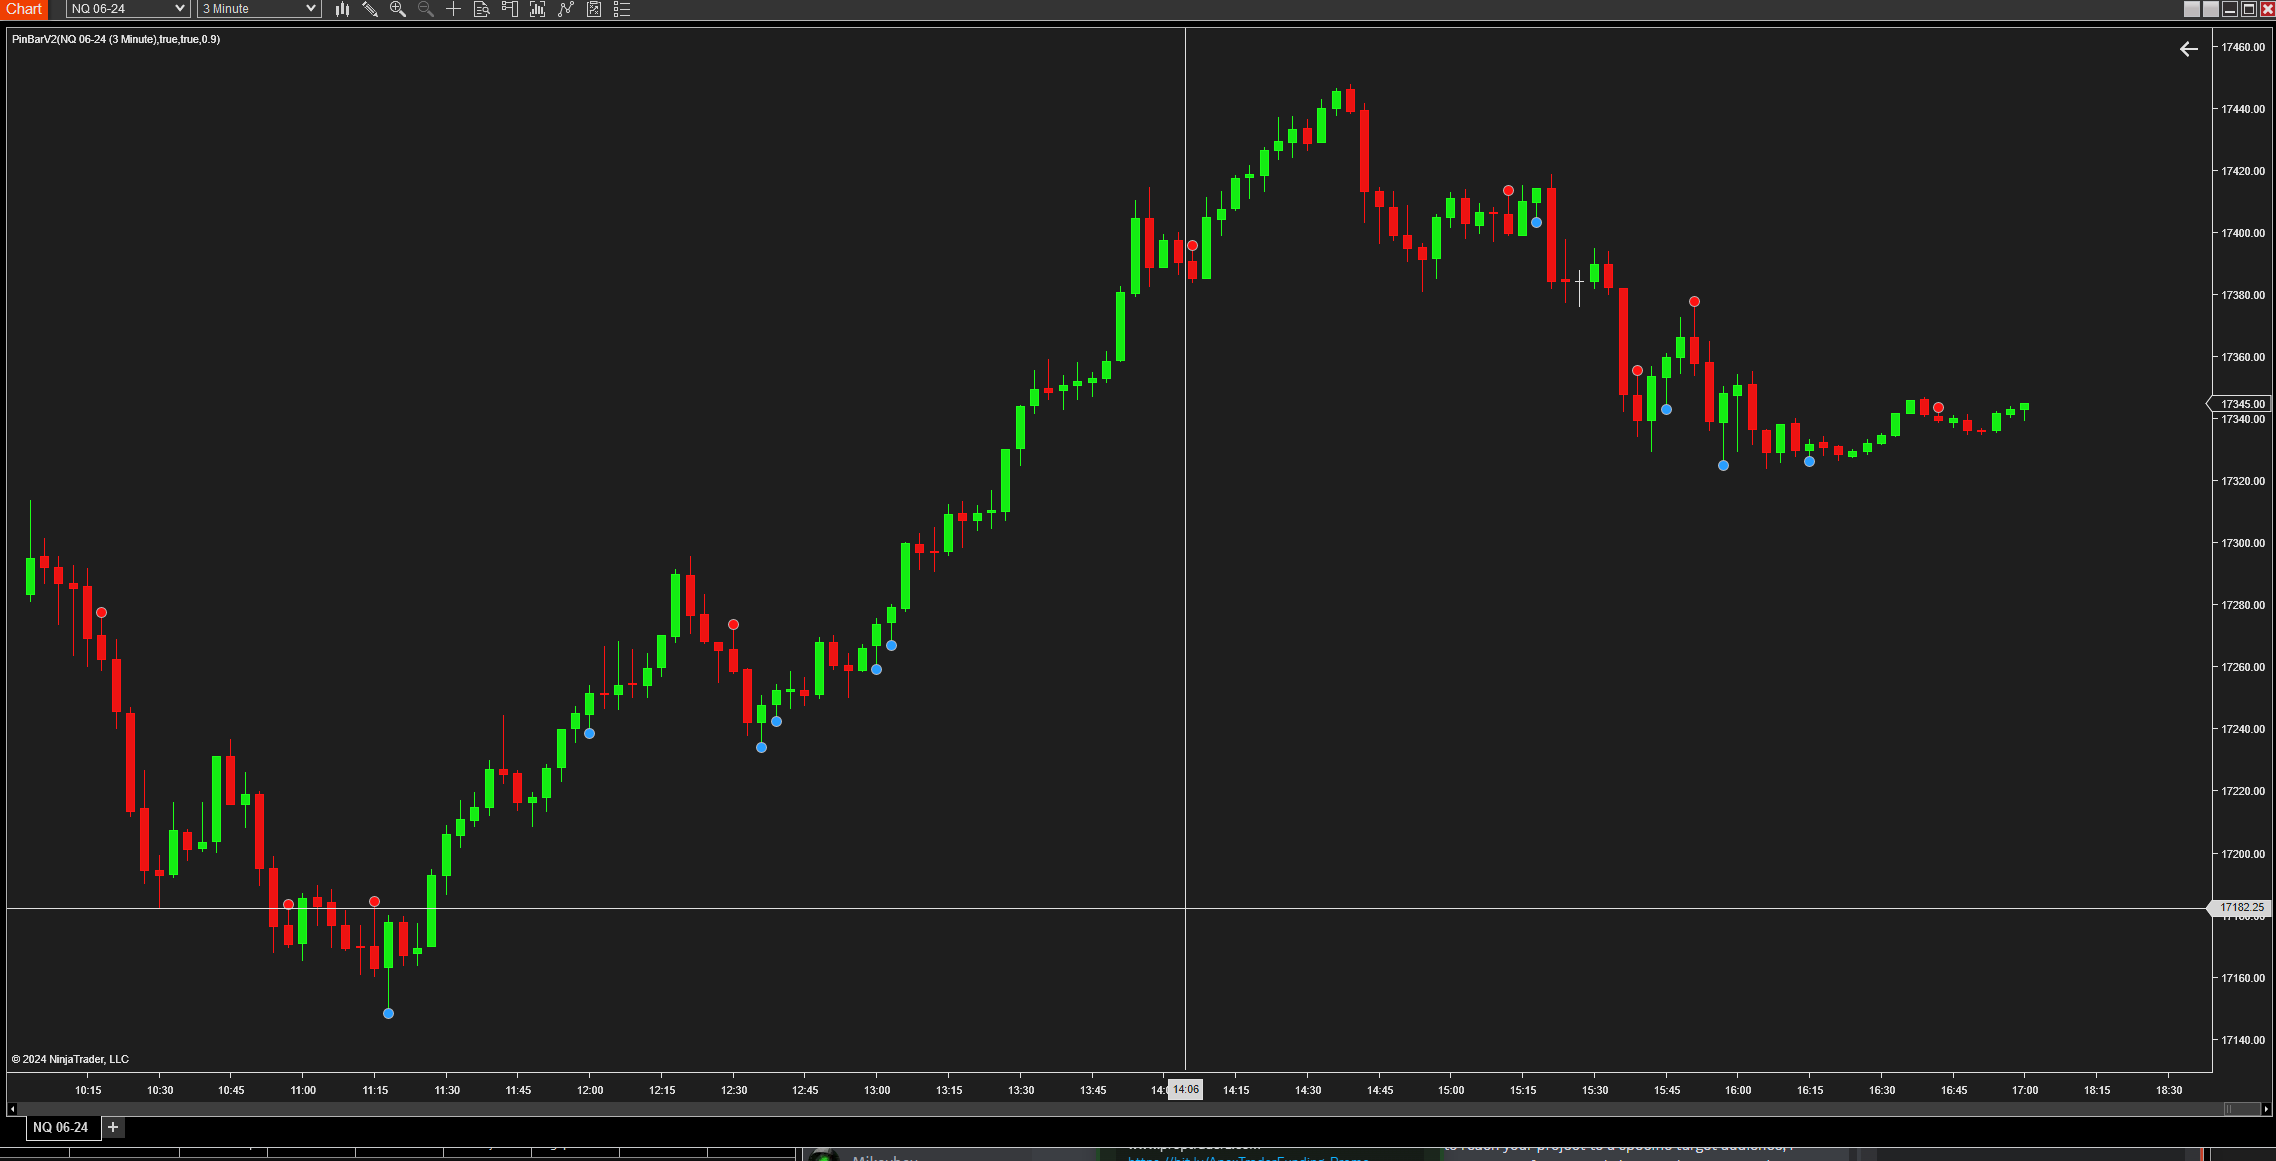
Pin Bar Indicator for NinjaTrader The Pin Bar Free Indicator is a robust tool designed for the NinjaTrader platform that identifies pin bar formations, which are key signals of potential market reversals. This indicator detects both bullish and bearish pin bars, offering traders a powerful method to spot high probability entry and exit points based on price action. Features: – Automatic Detection: Scans charts in real-time to identify the formation of bullish and bearish pin bars. – Customizable Sensitivity: Features an adjustable threshold multiplier that allows traders to set the sensitivity of pin bar detection, catering to both conservative and aggressive trading styles. – Visual Alerts: Marks identified pin bars…
-
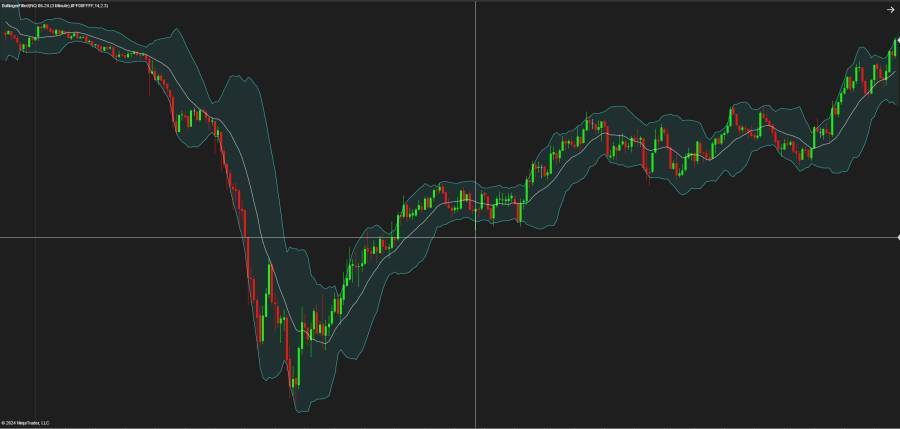
Bollinger Filled Bands
Bollinger Band with filled area between upper and lower Bands Bollinger Bands are plotted at standard deviation levels above and below a moving average. Since standard deviation is a measure of volatility, the bands are self-adjusting. Widening during volatile markets and contracting during calmer periods. The upper and lower bands are set to transparent by default. You can choose any color you want.
-
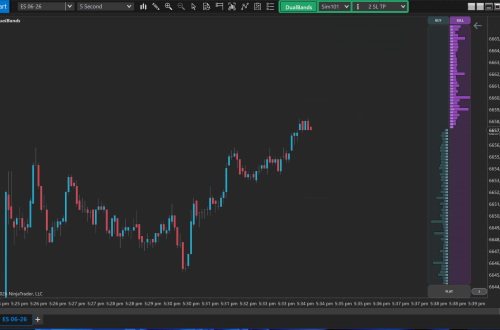
Squeeze Momentum
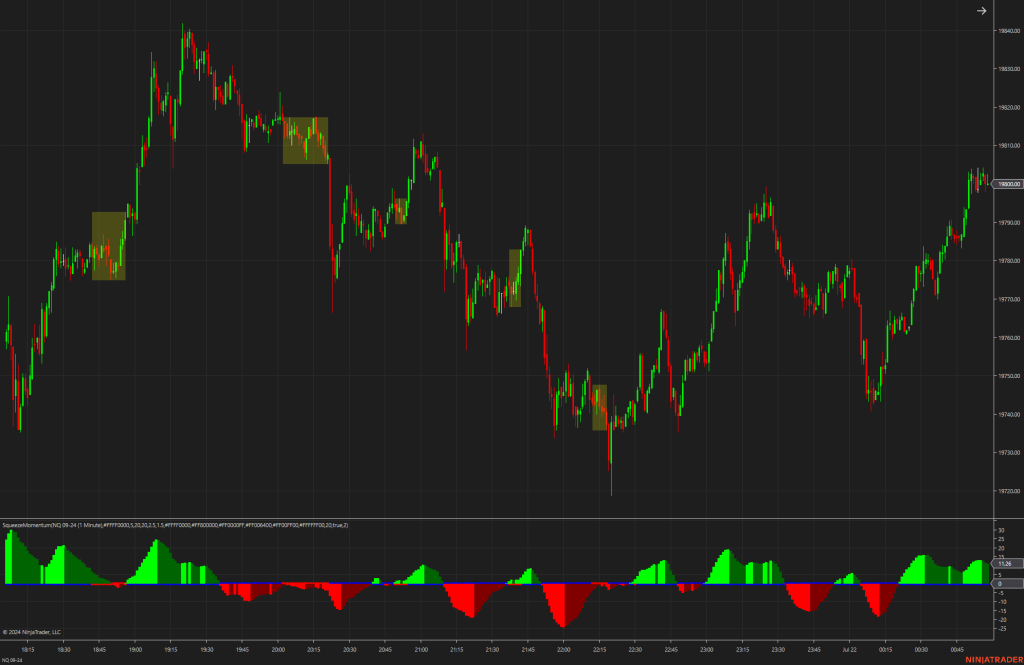
The Squeeze Momentum indicator is a tool that aims to help traders spot and capitalize on market “squeeze” situations, which often precede significant price movements. It uses a combination of Average True Range (ATR) and standard deviation calculations to identify when the market is in a squeeze—indicated by a period of lower volatility—and prepares traders for potential breakouts. With customizable settings for visual alerts and volatility boxes, it enhances the charting experience by highlighting crucial trading ranges. This indicator is suitable for traders who follow the Bollinger Bands and Keltner Channels strategies and are looking for a visual edge in their trading setup.
-
AbsoluteStrengthV1 -Free Add-On NT8
AbsoluteStrengthV1 -Free Add-On NT8 How it Works: At its core, the AbsoluteStrengthV1 indicator distinguishes between bullish and bearish market forces by measuring their absolute strength. Traders can select between two calculation methods: the RSI Method, which reflects the traditional Relative Strength Index, and the Stoch Method, inspired by Stochastic calculations. Adaptability and Customization: Adaptability is one of the standout features of AbsoluteStrengthV1 The indicator allows users to choose from six different types of moving averages, including Simple (SMA), Exponential (EMA), and more specialized ones like Hull (HMA) and Zero-Lag Exponential (ZLEMA). This level of customization ensures that traders can tailor the indicator to fit their unique trading strategies and market…