-
MFIProZone
MFIProZone is a NinjaTrader 8 indicator that enhances the classic Money Flow Index with an optional ADX trend filter for clearer buy/sell signals and better avoidance of choppy markets. Key Features of MFI Refined MFIProZone Signals Above 50? MFIProZone plots a bullish color to help you spot positive momentum. Below 50? A bearish color indicates a potential downtrend. Overbought/Oversold Thresholds (e.g., 62/38) let you know when to watch for reversals. ADX Trend Filter ADX Above Threshold (often 25) means the market is trending. Signals only trigger in trending conditions, helping you avoid false trades in sideways markets. Clear Visuals & Alerts Background shading for extreme (90–100) or start (80–90)…
-
Fair Value Gap – ICT
Fair Value Gap – ICT This is an update to the Inner Circle Trader (ICT) Fair Value Gap (FVG) v0.0.2.3 indicator by gemify. The image shows the extras I have added. The Max Lookback Bars was removed because all it did was prevent the indicator from detecting FVG for X bars. The two primary improvements added are: – Require FVG bars in the same direction. When enabled, the three FVG bars must all be up bars for an upward FVG to be detected. – Time Ranges: Pretty self-explanatory. The FVG can now be limited to the three Silver Bullet times or RTH. Plus several little tweaks internally. Future wish list improvements: I want…
-
Supertrend Indicator
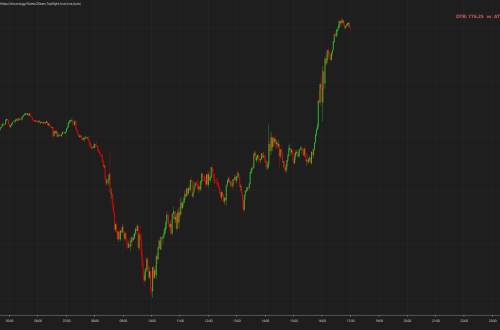
Introduction: The world of technical analysis is constantly evolving, with new tools and indicators being developed to assist traders in making informed decisions. One such indicator that has gained popularity in recent years is the Supertrend indicator. This article explores the Supertrend indicator and its application in the volatile market of July 2023. Overview of the Supertrend Indicator: The Supertrend indicator is a versatile tool used by traders to identify the prevailing trend in the market. It offers a clear visualization of the trend direction and provides potential entry and exit points for traders. The indicator is based on a combination of price and volatility, making it suitable for various…
-
Free OrderFlow Ladder -SuperDOM NT8
OrderFlow Ladder SuperDOM OrderFlow Ladder is a free order flow ladder for Ninjatrader v8. The SuperDOM column can display the following: This Super DOM Column plots the Buy and Sell Volume from the midpoint of the Column out to the left (Buy Volume) and to the right (Sell Volume) versus the Volume Super DOM Column which plots from left to right Last trades Buys / Sells in a configurable sliding time window (defaults to 60 seconds) + Imbalance detection Last prints or Largest prints at price in sliding window Session Buys / Sells + Imbalance detection Session and Sliding Window Buy/Sell histograms Potential ICE execution Bid/Ask + Bid/Ask stacking/pulling Bid/Ask…
-
Midas Indicator
The Market Interpretation/Data Analysis System (MIDAS) Midas Indicator is a technical analysis tool used to identify potential support and resistance levels in financial markets. It was developed by Paul Levine in the 1990s and is based on the market philosophy of using price and volume as primary drivers of price action. Here more details Wikipedia (In finance, MIDAS Midas indicator (an acronym for Market Interpretation/Data Analysis System) is an approach to technical analysis initiated in 1995 by the physicist and technical analyst Paul Levine, PhD, and subsequently developed by Andrew Coles, PhD, and David Hawkins in a series of articles and the book MIDAS Technical Analysis: A VWAP Approach to…
-
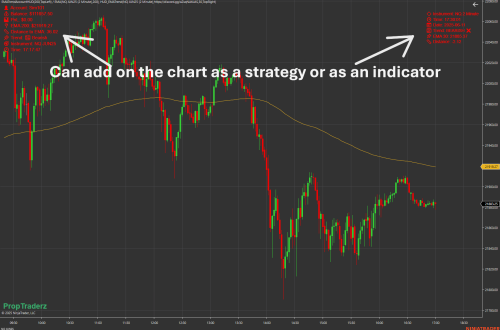
The Vegas Tunnel Strategy
For this trading strategy , you will need the following indicators: The indicator is a trend-following setup that will keep one out of choppy markets and on the right side of the trend. Here are some ATM strategies for take a profit and stop loss: ATM Strategies – to use the atm strategy go to Ninja Trader 8 file on your computer go to templates →strategies →and copy paste the files from this folder there(you will have to unzip) Then make the same way with the next folder STOP Strategies which are the stops and trailing, just that you will unzip the folder and will copy paste in the stop…
-
DR/IDR/FVG/ORB- Defining Range and Volume Indicators
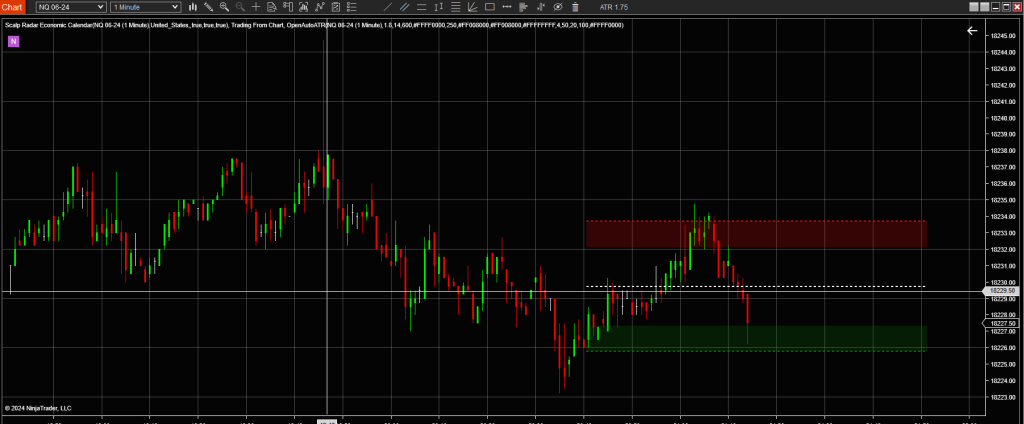
DR/IDR levels for NinjaTrader 8 DR/IDR levels are used in trading as key price levels for determining entry and exit points, as well as for setting stop-loss orders. Traders often use technical analysis techniques to identify these levels, such as support and resistance levels, trend lines, and chart patterns. For example, a trader may observe that a DR/IDR tends to find support at a certain price level, and therefore set a stop-loss order just below that level to minimize potential losses. Alternatively, a trader may look for a breakout above a key resistance level to signal a potential entry point into a long position. It’s important to note that using…
-
Reversal Candle Patterns
Reversal Candle This indicator will colour reversal candle Works best with UniRenko style charts. But will colour candles on any chart that meets the following criteria: (Bullish) -Low is below the previous candles’ low -Closes above the previous close -Current and previous candles are opposite colors. (Opposite for Bearish reversal) Adjust the offset to customize how much lower a reversal has to go from the previous candle. You can scalp a few ticks or points using this strategy alone. More about the candle reversal here It is an excellent strategy to use when trading a Prop account PA with a trailing drawdown
-
Scalping Futures with – EMA Crossover Strategy
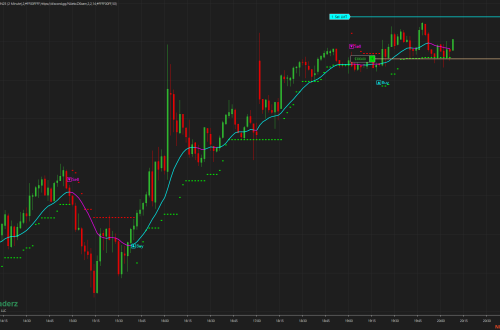
Scalping Futures with EMA Crossover Strategy Here are a few easy strategies to scalp futures for a few ticks or points (EMA) Crossover strategy The EMA crossover strategy involves using two EMAs to identify short-term trends in the market. EMA’S values can be changed on your preference ( see addon properties after downloading and adding in NT8) The “Channel SSL” (Secure Sockets Layer) is a technical analysis tool that is used to identify trends and potential trading opportunities in the market. It is a type of channel indicator that consists of two lines, one line above the price and one line below the price, which form a channel. The Channel…
-
Multiseries Levels
Multiseries Levels Indicator for NT8 This addon will plot on your chart different levels such as weekly, hourly, 15 min, etc low/highs. You will find in the indicators properties link about how to use it directly from his creator here. You will find the indicator after you import it in NT8 in the indicators list in the file named TradeSaber(the name of his creator) This addon will plot on your chart different levels such as weekly, hourly, 15 min, etc low/highs. You will find in the indicators properties link about how to use it directly from his creator here.