-
FootPrintV2 Chart for NT8
In trading, a footprint chart is a type of price chart that displays the volume of trades at each price level, rather than simply showing the price movements over time. Footprint charts are often used by traders to identify support and resistance levels, track the buying and selling pressure in the market, and detect potential trend reversals. A footprint – FootPrintV2 Chart for NT8 chart works by dividing the price range into small price increments, and then displaying the volume of trades that occurred at each price level using different colours or shades. The resulting chart shows the distribution of trading activity across the price range, highlighting areas of high…
-
Indicators & AddOns NinjaTrader8
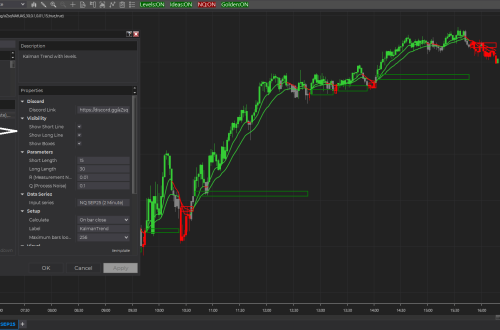
Indicators & AddOns NinjaTrader8 HMA Wave This is another adaptation of the HMA. Big Mike( from futures.io) built a similar indicator years ago for NT7 and it was based on the EMA. I like the HMA because it hugs the price better and changes direction sooner. This indie paints 2 HMAs that trail the primary HMA by x candles. This HMA can be smoothed by an EMA of 1 or greater periods. In addition, you can colour the background based on the slope of the HMA. As with many of my recent indicators, they only calculate what is on the screen. The indie will not show if you scroll back…
-
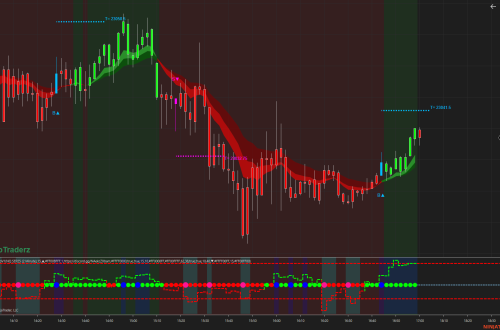
Market Structure – Order Blocks and FVG-ICT
Market structure Market structure is a critical concept in trading and investing. Understanding market structure can help traders and investors make more informed decisions and improve their overall performance. In this article, we will explore what market structure is, why it matters, and how it can be analyzed. What is Market Structure? Market structure refers to the way in which a market is organized, including its participants, trading rules, and the types of securities being traded. It can be thought of as the “framework” within which trading activity takes place. Market structure can vary depending on the type of security being traded, the exchange on which it is traded, and…
-
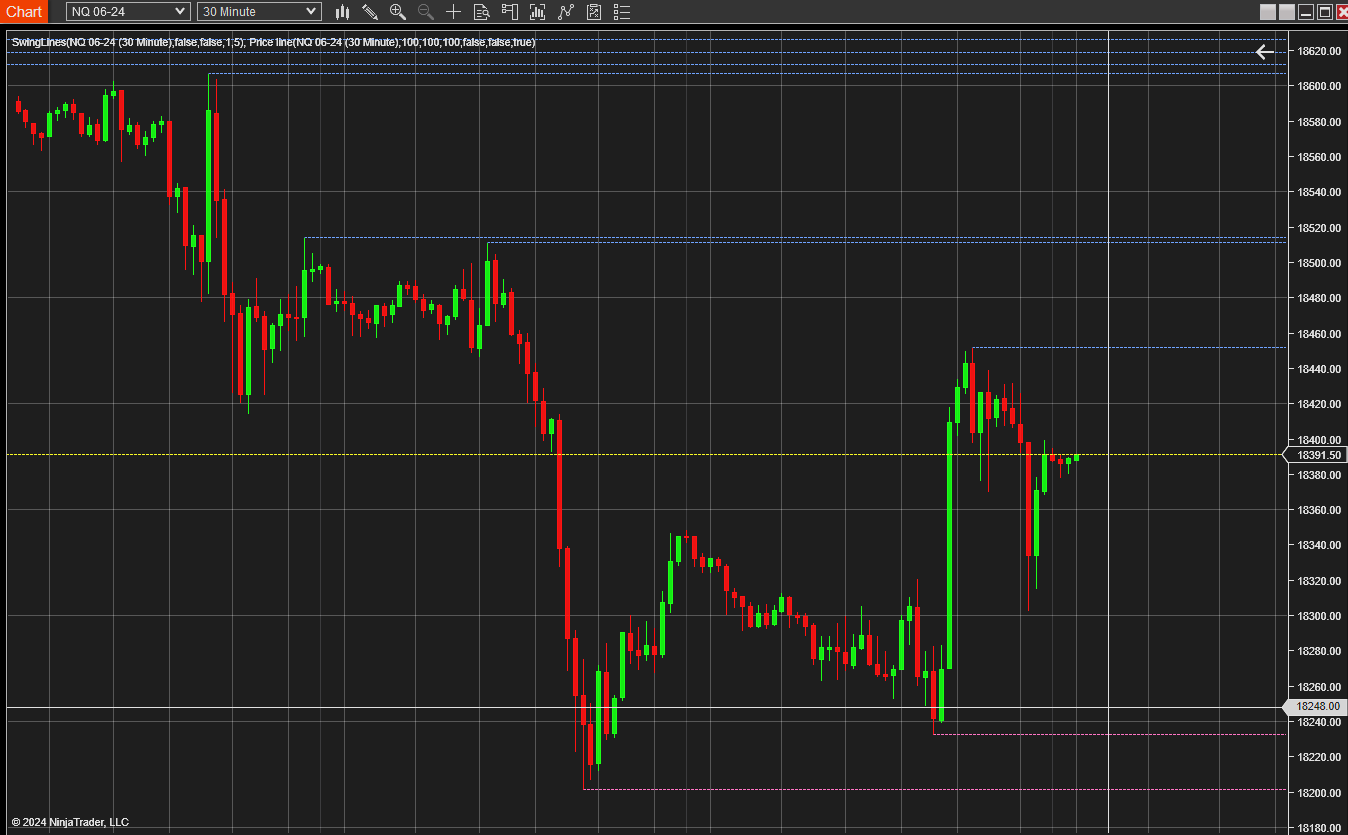
DynamicSRLines
This indicator draws horizontal Support/Resistance lines at various price levels, above and below the market, where price historically created swing High/Low pivots multiple times, creating support and resistance as price action bounced off of those levels. Created By NinjaTrader_JoshG NinjaTrader Version 8 File Size 3.2 KB Create Date 01/19/2018 # of Downloads 8344 and counting
-
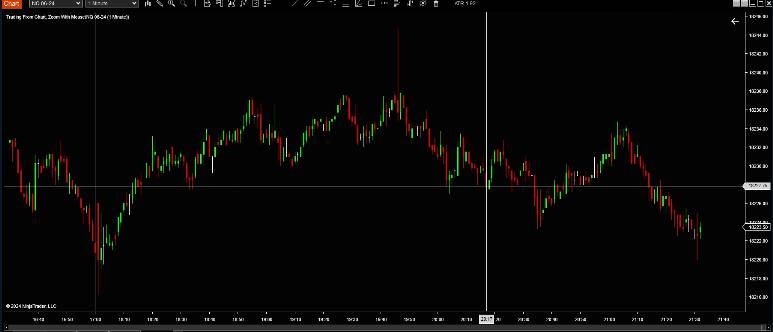
Initial Balance Indicator
The initial balance refers to the price range and trading volume of the first few minutes of a trading session. The initial balance is often used as a reference point for traders to determine the market trend and to develop trading strategies for the rest of the session. The Initial Balance strategy involves placing trades based on the market’s direction after the initial balance period has ended. The Initial Balance period typically lasts for the first 30 minutes to 1 hour of a trading session, during which the market is usually the most volatile. Traders often use this time to assess the market and establish the direction of the trend.…
You May Also Like

ICT FVG(fair value gap) & Pat Toolbar
Prop AlgoV1

Indicators & AddOns NinjaTrader8
-
The Eight- Free Pack Indicators NT8
The Eight-Free Pack Indicators NT8 Inside the free package, you will find 8 indicators for NinjaTrader 8 trading platform to speed up and simplify intraday futures trading. The download link is found at the bottom of this article, please read carefully about how to activate this indicator. The indicators are free to use and are created for NT8 by In order to activate and also get the free lifetime license for these indicators, you will have to send an email containing the machine ID where the indicators will be activated. Send your machine ID to team@mascapital.uk ATTENTION!!! If you are interested in any other indicators or auto-traders created by MasCapital…
-
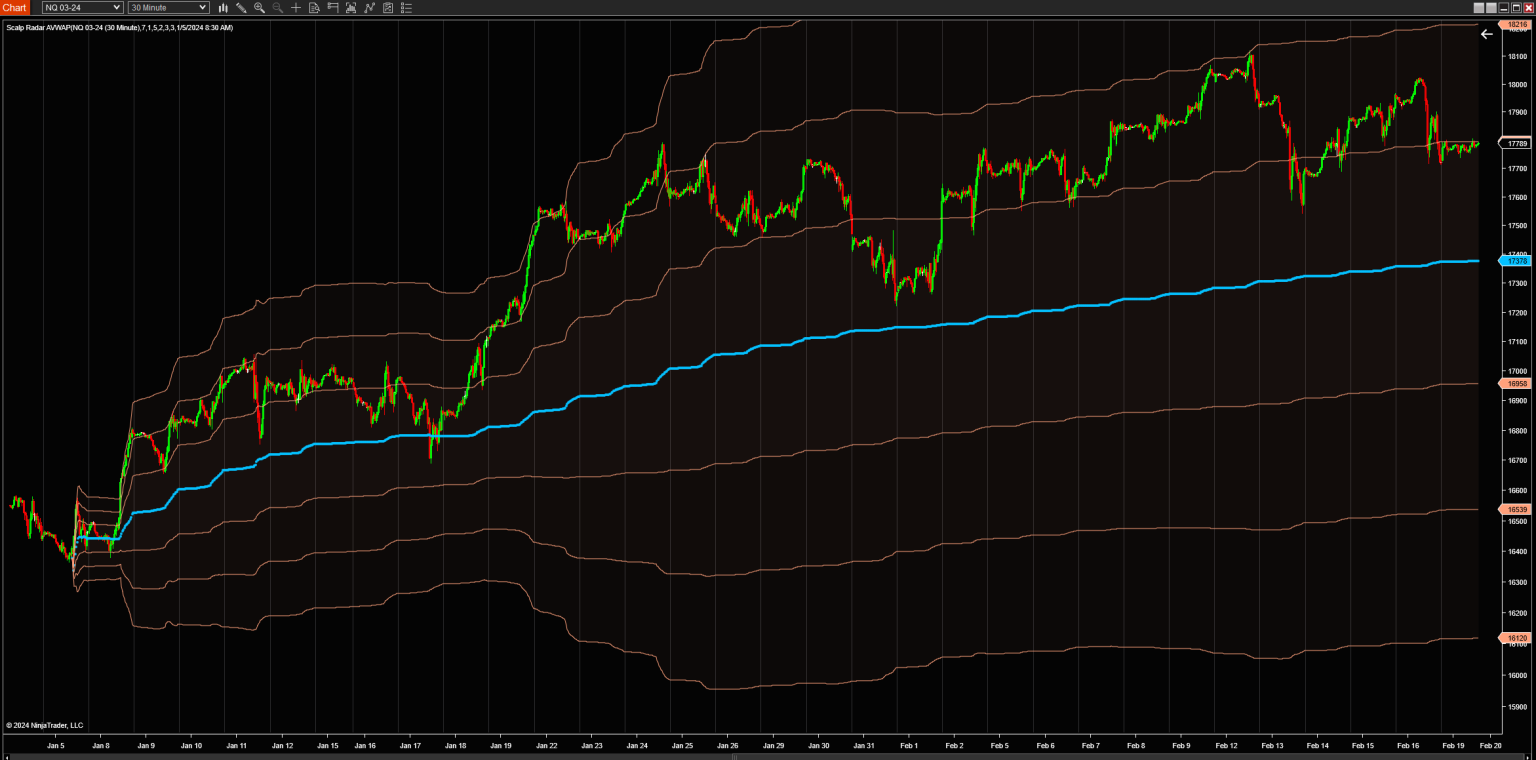
Midas Indicator
The Market Interpretation/Data Analysis System (MIDAS) Midas Indicator is a technical analysis tool used to identify potential support and resistance levels in financial markets. It was developed by Paul Levine in the 1990s and is based on the market philosophy of using price and volume as primary drivers of price action. Here more details Wikipedia (In finance, MIDAS Midas indicator (an acronym for Market Interpretation/Data Analysis System) is an approach to technical analysis initiated in 1995 by the physicist and technical analyst Paul Levine, PhD, and subsequently developed by Andrew Coles, PhD, and David Hawkins in a series of articles and the book MIDAS Technical Analysis: A VWAP Approach to…
-
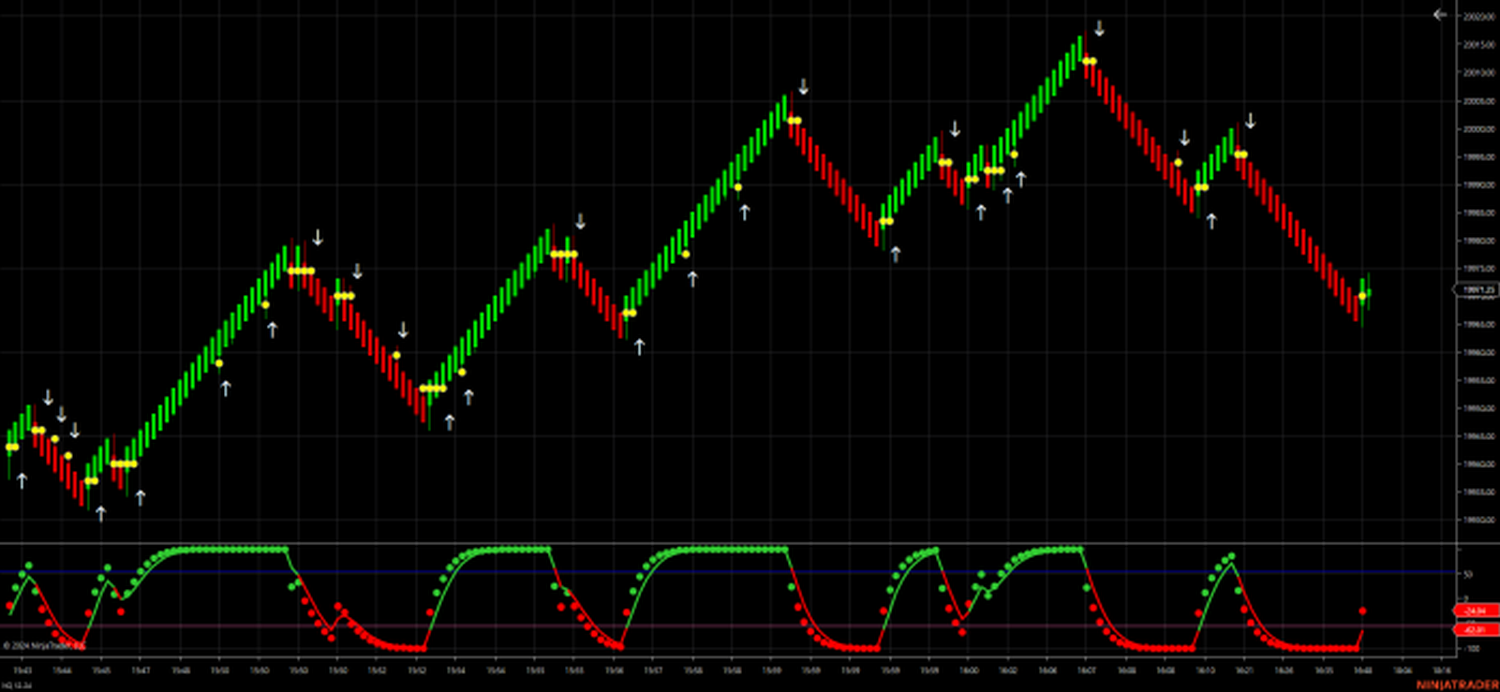
Reversal Candle Patterns
Reversal Candle This indicator will colour reversal candle Works best with UniRenko style charts. But will colour candles on any chart that meets the following criteria: (Bullish) -Low is below the previous candles’ low -Closes above the previous close -Current and previous candles are opposite colors. (Opposite for Bearish reversal) Adjust the offset to customize how much lower a reversal has to go from the previous candle. You can scalp a few ticks or points using this strategy alone. More about the candle reversal here It is an excellent strategy to use when trading a Prop account PA with a trailing drawdown