-
Auto Swing Indicator with toolbar and comprehensive support/resistance identification
Auto 3 Swing Indicator with toolbar and comprehensive support/resistance identification **NOTE** The version has been updated. The previous version must be uninstalled before importing. 1.Open Ninjatrader 8 2.Click on TOOLS > REMOVE NINJASCRIPT ASSEMBLY 3.Select ActiveGeoking from the list and process removal 4.Import new ZIP file attached to this listing via TOOLS > IMPORT > NINJASCRIPT ADDON Triple Trend Feature In the top right corner of the chart, you will notice SML, MED and LGE printed in either RED or GREEN. GREEN = Trend up RED = Trend down SML is the smallest Zig Zag swing being PINK in colour on the picture in the post above. It is impossible…
-
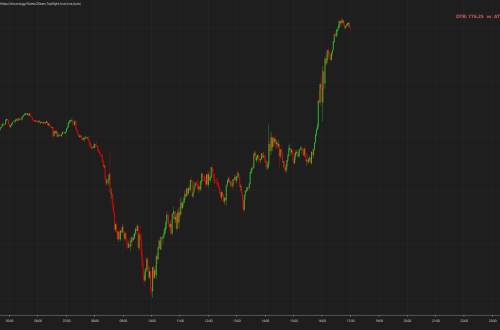
Stock market 23 August2023
Stock Futures Mixed Ahead of Earnings Season and Fed Rate Decision Stock futures were mixed on Wednesday morning, August 23, 2023, as investors awaited the start of earnings season and the Federal Reserve’s decision on interest rates. Dow Jones Industrial Average futures were up 129 points, or 0.37%, to 34,694.** S&P 500 futures were up 23.75 points, or 0.54%, to 4,406.50. Nasdaq 100 futures were up 107 points, or 0.73%, to 14,851. Investors are looking ahead to the start of earnings season, which kicks off with major banks on Thursday. Analysts expect earnings growth to slow in the third quarter, as companies grapple with rising inflation and supply chain disruptions.…
-
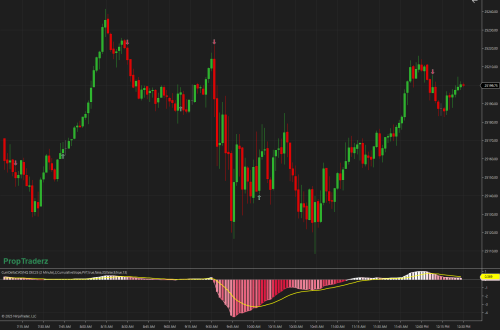
dp QGP Channels
dpQGP- QGPair. It is now a pair of channels, fast (Trend1 and Trend2) and slow (Trend3 and Trend4), and as price moves around those channels, signals are generated. Everything is available for your tweaking: channel coloring, signal type/color/size, channel upper and lower parameters. In the Properties, there is a property named ‘ContinuationSignals’ and it has a numeric input. That number is the number of bars allowed between price falling below Trend1 and rising back above it for long signals, or price rising above Trend1 and then falling back below Trend1 for short signals. It will become clear when you see it on your chart. There is a Toggle on the…
-
Obsidian Indicator Suite for NinjaTrader 8-Autotrader
Enhance Your Trading with the Obsidian Indicator Suite for NinjaTrader 8 Obsidian Indicator Suite – by Obsidian Indicators Unleash the power of automated trading with the Obsidian Indicator Suite for NinjaTrader 8. A collection of innovative indicators, including the Automated Dark Diamond Trend Sniper, specially designed for precision and adaptability in different market conditions. Start your 7-day free trial here! As market conditions continually shift and evolve, trading strategies need to do the same. That’s why we’ve developed the Obsidian Indicator Suite — an all-encompassing collection of powerful trading indicators, designed exclusively for NinjaTrader 8. The suite integrates our finest indicators, combining robust features and cutting-edge technology, making it an essential…
-
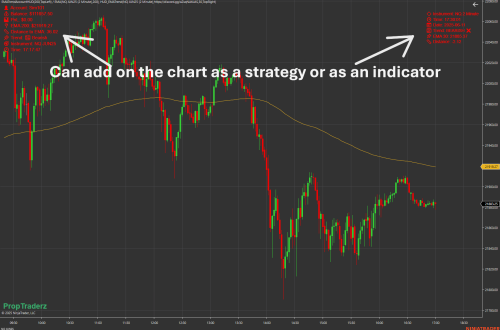
The Joe Ross EMA Strategy Add-on
The Joe Ross EMA (Exponential Moving Average) Crossover Strategy is a trend-following trading strategy developed by Joe Ross, a well-known trader and author. This strategy uses two Exponential Moving Averages with different periods to identify potential entry and exit points in the market. Here’s how the strategy works: Indicators: – EMA 9 (Exponential Moving Average with a period of 9) – EMA 18 (Exponential Moving Average with a period of 18) Entry Rules: 1. Buy Signal (Bullish Crossover): – When the EMA 9 crosses above the EMA 18, it generates a buy signal. – Enter a long position when the bullish crossover occurs. 2. Sell Signal (Bearish Crossover): – When…
-
Risk Reward Tool
Risk Reward Tool Ninjatrader comes with a built-in risk/reward drawing tool. However, i like the one from Tradingview much better This drawing tool adds a trading view look-a-like risk/reward tool to ninja trader for both long and short positions When placing an R/R drawing tool on your chart you can move it around, drag the stop loss/target to its correct price levels and the risk/reward ratio will be updated in real time After installing you can find the risk/reward tools under the drawing tools menu. There’s a long-position tool and a short-position drawing tool Note you can assign keyboard shortcuts to the risk/reward drawing tools using the tools->Hot Keys menu.
-
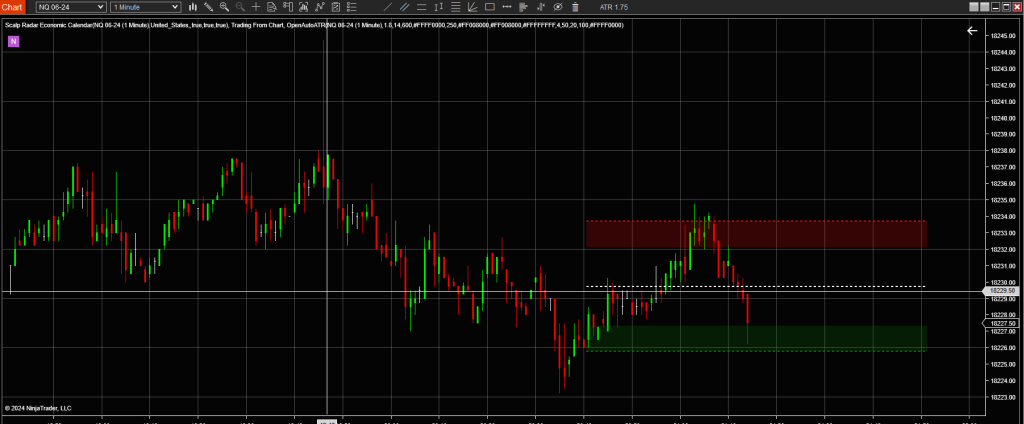
OPENING RANGE ORB -NinjaTrader
OPENING RANGE ORB -NinjaTrader is the range obtained from the highest and lowest price of a security during the first minutes of daily trading activity. For example the opening range can be calculated from the first 5, 15 or 30 minutes. The opening period can be selected via the time zone, the start time and the end time of the opening period. For example, if you wish to display a 30-minute opening range for ES, you would select Exchange_Time or US_Central_Standard_Time, a start time of 8:30 AM and an end time of 9:00 AM. The indicator will then display the regular open and the opening range high, low and midline.…
-
Fair Value Gap – ICT
Fair Value Gap – ICT This is an update to the Inner Circle Trader (ICT) Fair Value Gap (FVG) v0.0.2.3 indicator by gemify. The image shows the extras I have added. The Max Lookback Bars was removed because all it did was prevent the indicator from detecting FVG for X bars. The two primary improvements added are: – Require FVG bars in the same direction. When enabled, the three FVG bars must all be up bars for an upward FVG to be detected. – Time Ranges: Pretty self-explanatory. The FVG can now be limited to the three Silver Bullet times or RTH. Plus several little tweaks internally. Future wish list improvements: I want…
-
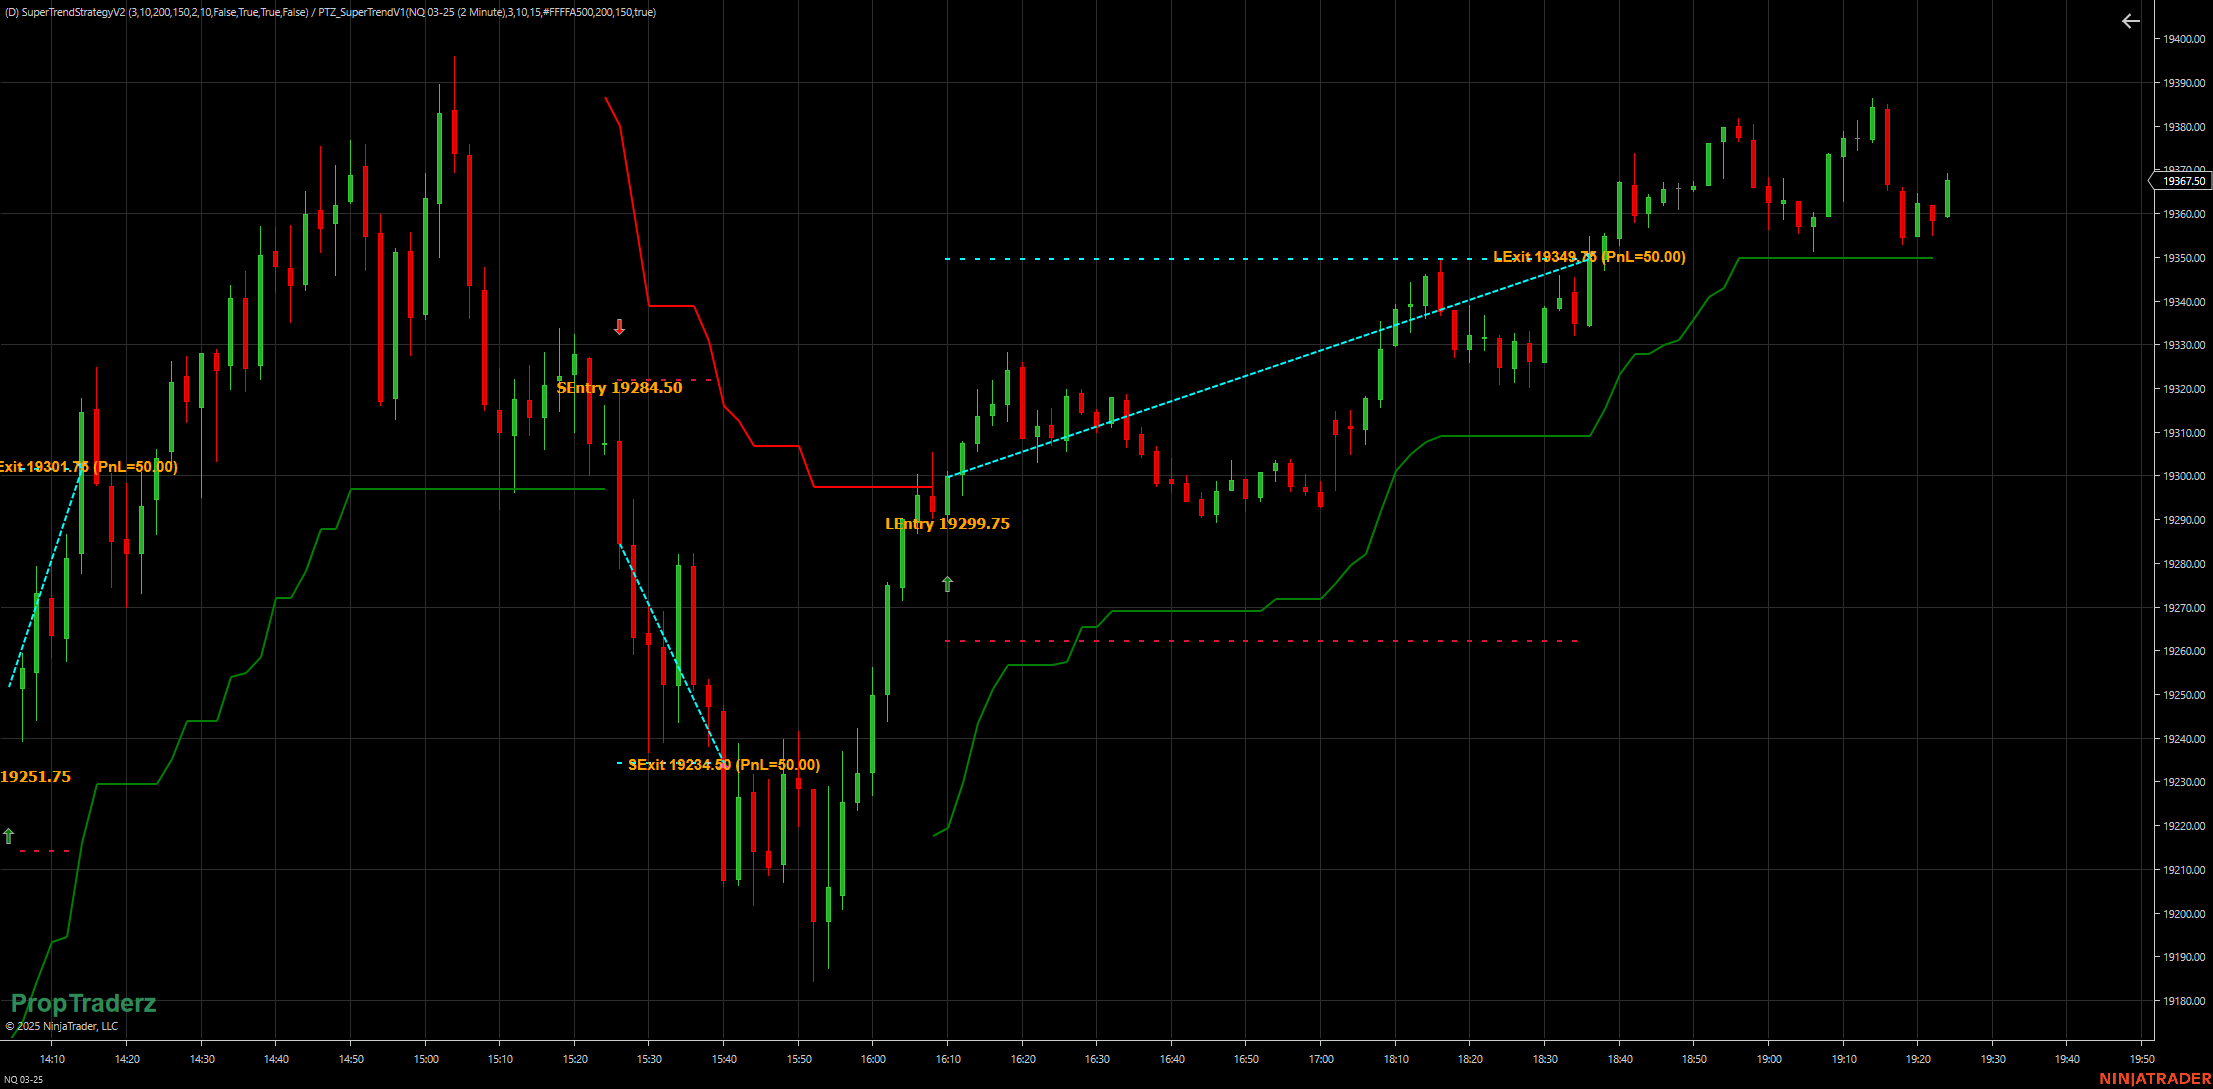
Supertrend Indicator
Introduction: The world of technical analysis is constantly evolving, with new tools and indicators being developed to assist traders in making informed decisions. One such indicator that has gained popularity in recent years is the Supertrend indicator. This article explores the Supertrend indicator and its application in the volatile market of July 2023. Overview of the Supertrend Indicator: The Supertrend indicator is a versatile tool used by traders to identify the prevailing trend in the market. It offers a clear visualization of the trend direction and provides potential entry and exit points for traders. The indicator is based on a combination of price and volatility, making it suitable for various…
You May Also Like

MTFCloudsV1: Precision EMA Clouds
HUD-Head Up Display Indicator /Strategy

PTZ Wave
-
Exploring Stochastic Oscillator-how to use Stochastic Oscillator
Exploring Stochastic Oscillator: A Guide to Utilizing Technical Analysis In the subsequent segment of our series on technical analysis and indicators, we will delve into another momentum oscillator known as the Stochastic Oscillator. This particular indicator gauges the velocity and momentum of an instrument’s price movement while identifying trends and their shifts. George Lane, the developer of the Stochastic Oscillator in the 1950s, proposed that the change in momentum or speed of an instrument’s price movement occurs before the price itself changes direction. Lane emphasized that the Stochastic Oscillator does not track the price directly, nor does it consider volume or other factors. Instead, it focuses solely on the speed…
You May Also Like
EMA CROSS SIGNALS