-
The U.S. Debt-Ceiling Crisis: Implications and Potential Economic Impacts
Introduction: The United States is currently facing a critical debt-ceiling crisis, with a looming deadline of June 1, 2023. The debt ceiling refers to the statutory limit on the amount of debt the U.S. government can issue to fund its operations. The failure to raise the debt ceiling would have explosive consequences, potentially leading to a default on the government’s debt obligations. This article will explore the ongoing debt-ceiling crisis, the implications of not raising the debt ceiling, and the potential economic impacts it could have. Current Status and Political Stalemate: As of May 22, 2023, leaders on both sides of the debate have yet to reach an agreement on…
-
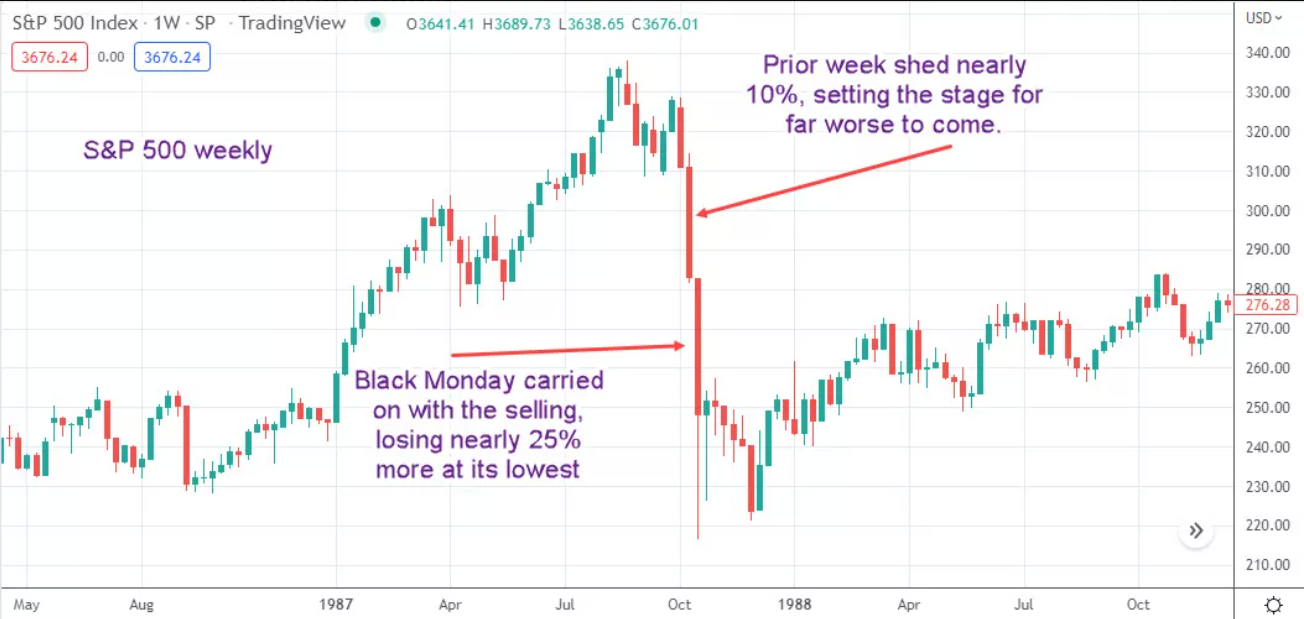
How to trade chart patterns?
How to trade chart patterns? Have you ever looked at the chart and had a feeling of Deja-Vu? A feeling that the chart or candlestick pattern is repeating itself in some ways? This is because certain movements in the market keep repeating and for this reason, there are candlestick and chart patterns. Their history can be dated back to the very first discovery of Japanese candlesticks and nowadays they are a necessary part of technical analysis. On the internet, you may find unlimited information and study materials on this matter, and although there may be slight differences in each of the explanations, it is important to understand the most basic…
-
Order Flow Trading Glossary
1 TICK TEST/FAIL This is a condition where the market tests the prior day’s high or low or the current IB high or low by 1 tick before finding the opposing force pushing it the other way. This is generally considered a failed test of a significant area. ABSORPTION Price Absorption occurs when aggressive market participants Hit the Bid or Lift the Offer on high volume, and are met with participants who “absorb” all of the orders. The effect of this price Absorption is that price moves very little or not at all. Price Absorption can often lead to short-term reversals when the original aggressive participants give up and close their positions. See Absorption Reversal. ABSORPTION REVERSAL An Absorption Reversal Long occurs where aggressive sellers…
-
Trade Stocks and Commodities With the Insiders-Williams Larry
Trade Stocks and Commodities With the Insiders” is a book written by Larry Williams that provides insights into how professional traders and insiders operate in the stock and commodity markets. The book discusses various trading strategies and techniques that have been used by insiders and provides readers with practical advice on how to implement them. It covers topics such as market psychology, technical analysis, and risk management. The author also shares his personal experiences and lessons learned from trading in the markets for over 50 years. Overall, the book is a valuable resource for both novice and experienced traders who want to gain an edge in the markets by learning…
-
THE RIGHT STOCK AT THE RIGHT TIME -Larry Williams
The Right Stock at the Right Time” is a book written by Larry Williams, a well-known trader and author in the field of financial trading. In the book, Williams offers insights and strategies on how to identify the right stock at the right time in order to make profitable trades in the stock market. He covers topics such as market timing, technical analysis, and risk management, and shares his own experiences and lessons learned from over 50 years of trading. Williams emphasizes the importance of having a solid trading plan and sticking to it, as well as the need for discipline and patience in order to achieve success in the…
-
Trading Strategies in Futures Markets
James Grant’s book provides a comprehensive guide to trading futures, covering a range of topics such as technical analysis, market psychology, and risk management. The book also provides real-world examples and practical insights to help traders improve their trading strategies. One of the strengths of the book is its focus on the importance of risk management, emphasizing the need for traders to protect themselves against potential losses. The book also includes a discussion on the impact of market news and events on futures trading, providing valuable insights into the factors that can affect price movements. Overall, “Trading Strategies in Futures Markets” is a useful resource for traders of all levels,…
-
FootPrintV2 Chart for NT8
In trading, a footprint chart is a type of price chart that displays the volume of trades at each price level, rather than simply showing the price movements over time. Footprint charts are often used by traders to identify support and resistance levels, track the buying and selling pressure in the market, and detect potential trend reversals. A footprint – FootPrintV2 Chart for NT8 chart works by dividing the price range into small price increments, and then displaying the volume of trades that occurred at each price level using different colours or shades. The resulting chart shows the distribution of trading activity across the price range, highlighting areas of high…
You May Also Like
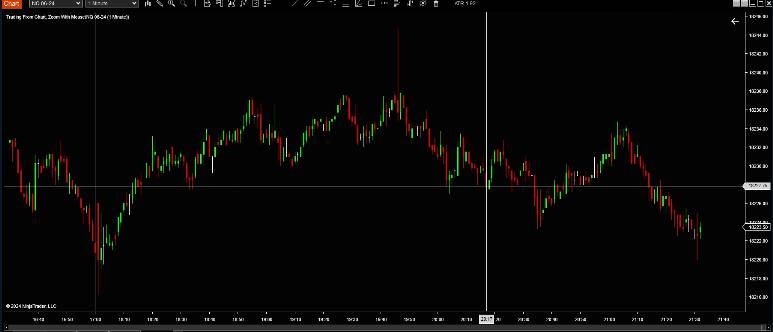
Free Zoom Chart Indicator

Free OrderFlow Ladder -SuperDOM NT8

Fair Value Gap – ICT
-
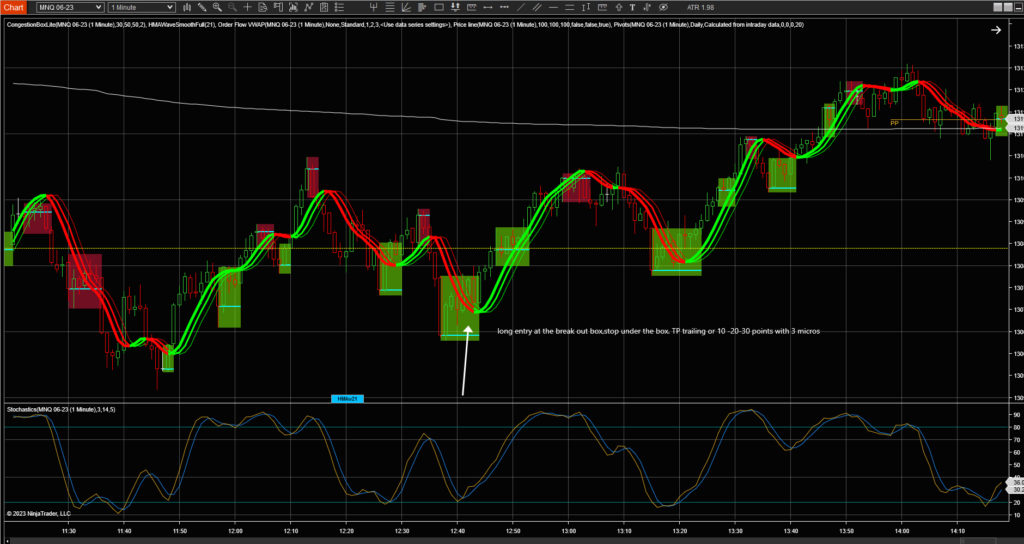
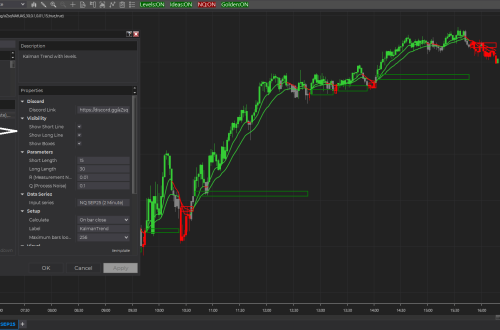
Scalping Strategy For Prop Traders
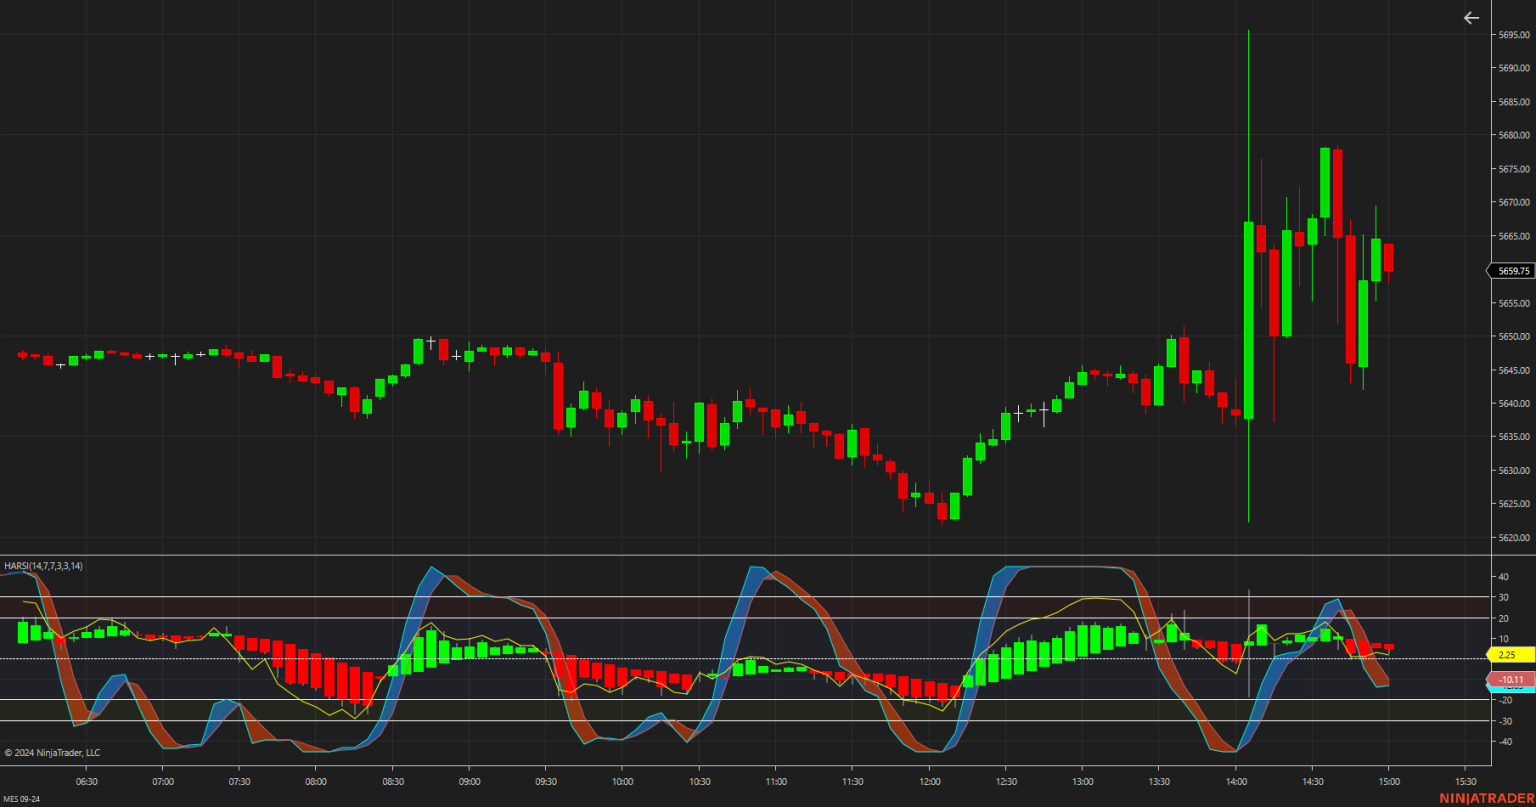
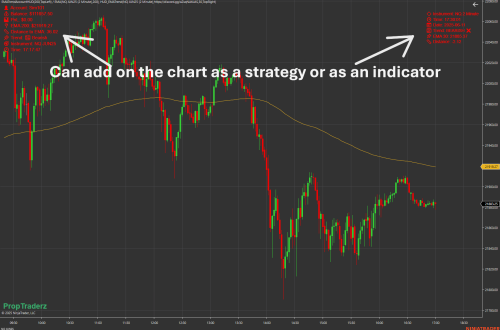
A Scalping Strategy For Prop Traders but not only- using HMA Wave, Congestion Box, and Stochastic Indicator THE SECRET: Take small profits or trail it. Do NOT become greedy Are you looking for a high-probability scalping strategy that can help you take advantage of short-term price movements in the market? If so, then this article is for you! In this article, we will explore a scalping strategy that combines the HMA Wave indicator, Congestion box, and Stochastic indicator to identify potential trading opportunities. The HMA (Hull Moving Average) Wave indicator is a powerful trend-following indicator that provides visual cues for identifying trend direction and momentum. It consists of three lines…
-
Indicators & AddOns NinjaTrader8
Indicators & AddOns NinjaTrader8 HMA Wave This is another adaptation of the HMA. Big Mike( from futures.io) built a similar indicator years ago for NT7 and it was based on the EMA. I like the HMA because it hugs the price better and changes direction sooner. This indie paints 2 HMAs that trail the primary HMA by x candles. This HMA can be smoothed by an EMA of 1 or greater periods. In addition, you can colour the background based on the slope of the HMA. As with many of my recent indicators, they only calculate what is on the screen. The indie will not show if you scroll back…
-
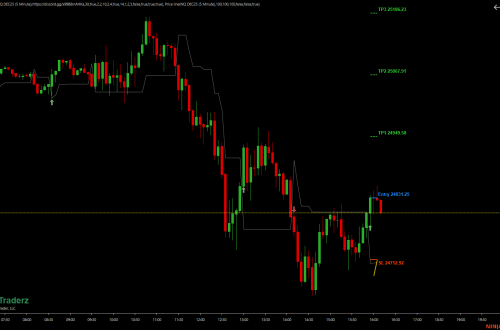
Navigating U.S. Open Futures Markets: A Trading Plan Based on European Session Trends and Safe Haven Assets
Trading US Open Futures Markets based on European Session Volumes and Trends Trading futures can be a profitable way to invest your money, but it requires a lot of knowledge, skill, and strategy. One strategy that has proven effective is trading US open futures markets based on European session volumes and trends. In this article, we will explore this strategy and how it can help you make profitable trades. The European session is the most active trading session in the world, with London being the financial hub of Europe. The European session opens at 2:00 AM EST and closes at 11:00 AM EST. During this session, most of the financial…