
Volume Delta Boxes – TradingView Indicator
TradingView — Free Indicator
Volume Delta Boxes — Exact Footprint
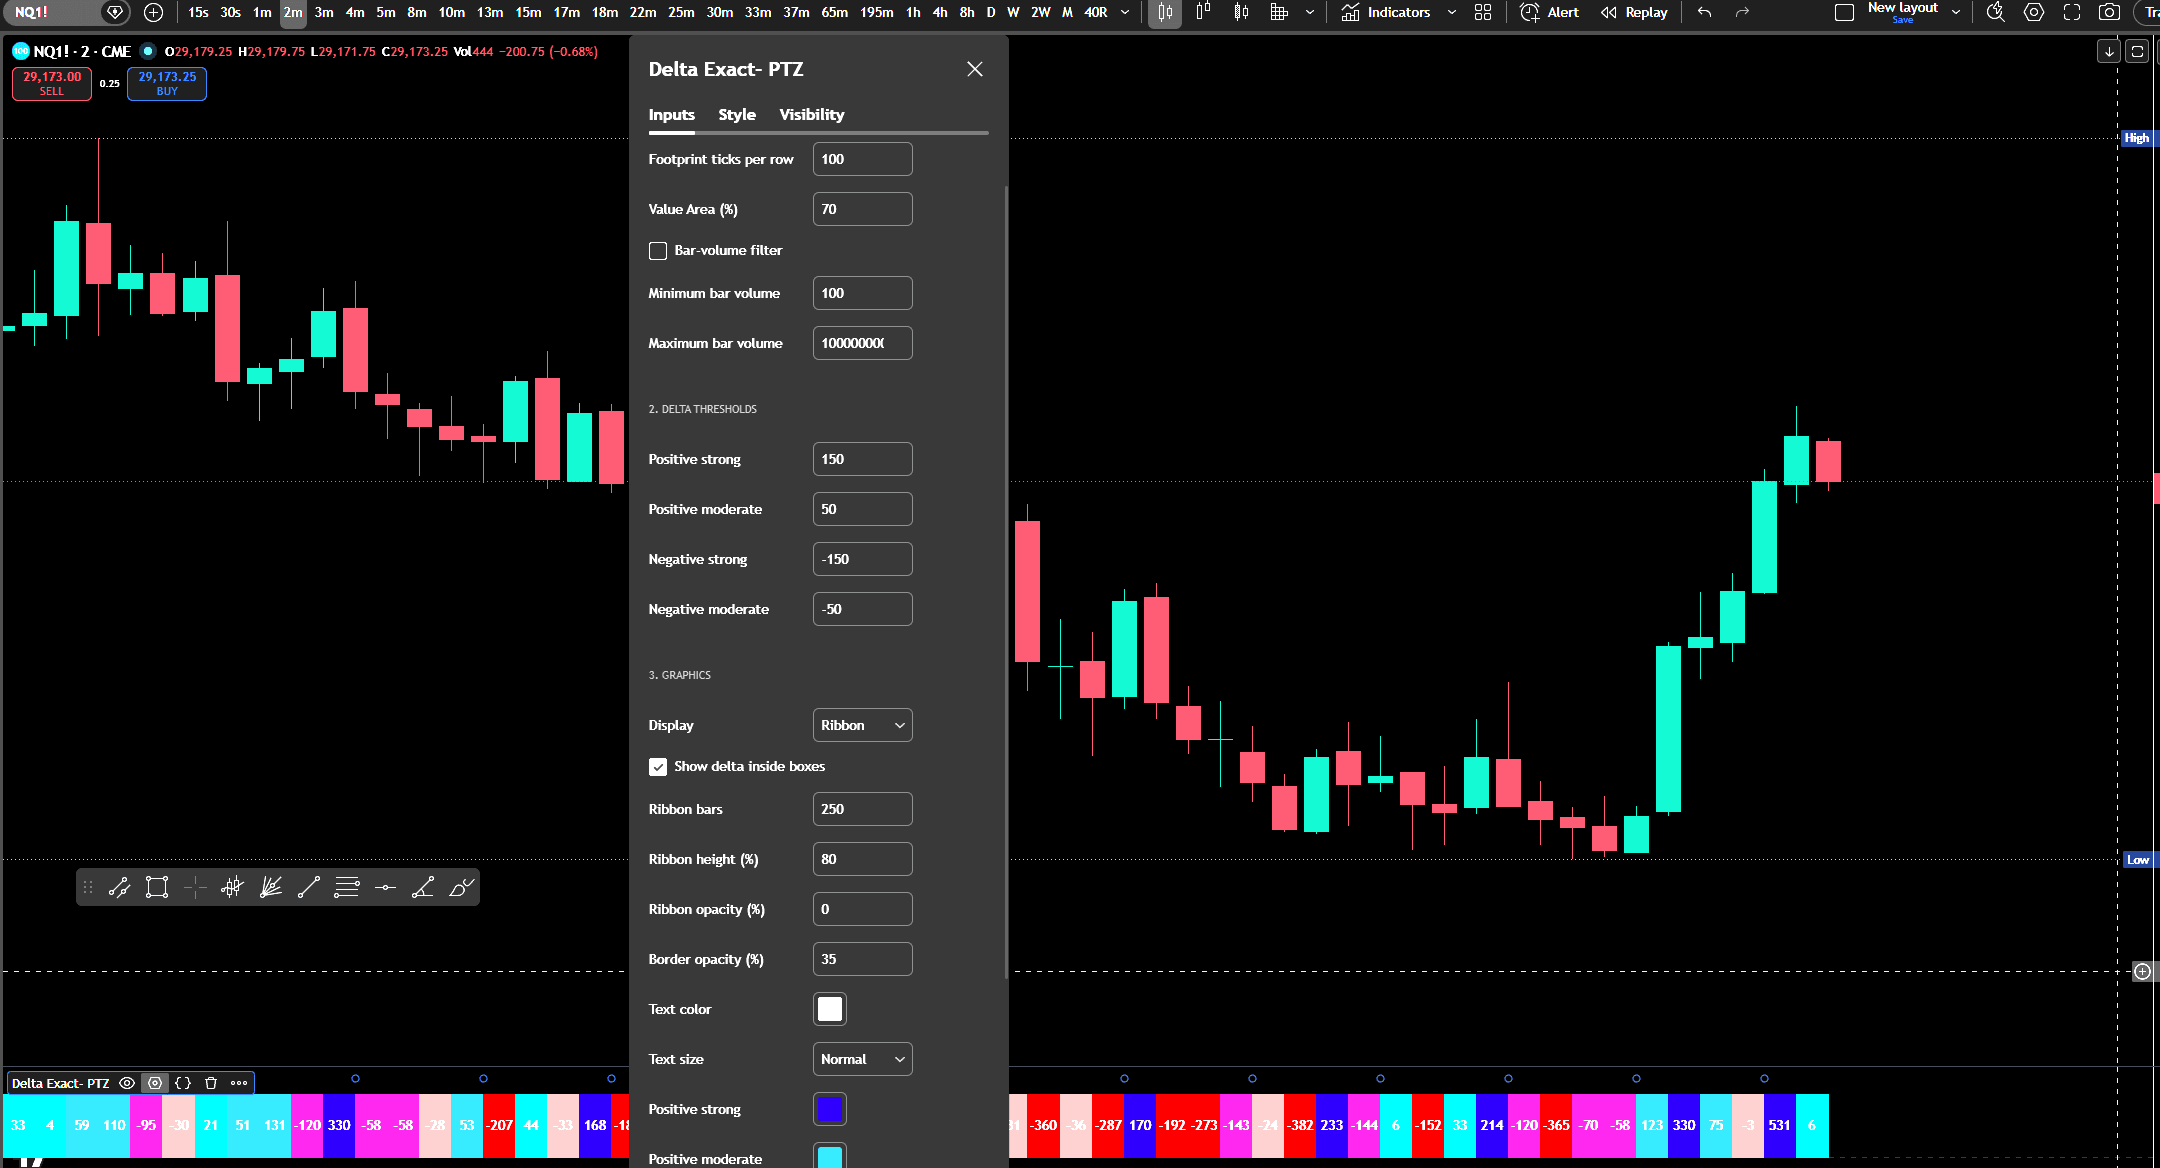
Native footprint data. Color-coded delta ribbon for every candle — no estimation, no Tick Replay.
What Is Volume Delta?
Instead of estimating buying and selling pressure from candle direction, the Exact Footprint version uses TradingView’s native footprint data to retrieve Buy Volume and Sell Volume for each bar.
Volume Delta = Buy Volume − Sell Volume
Positive Delta
Buy Volume greater than Sell Volume
Negative Delta
Sell Volume greater than Buy Volume
Larger Values
Stronger imbalance between buyers and sellers
Three Display Modes
🟦
Ribbon
Colored box for every candle
📊
Histogram
Positive and negative delta columns
🟦📊
Ribbon + Histogram
Both visualizations simultaneously
Main Features
✅
Native request.footprint() data — no estimation, no Tick Replay
Native request.footprint() data — no estimation, no Tick Replay
🎨
Seven delta categories with fully customizable colors and thresholds
Seven delta categories with fully customizable colors and thresholds
📦
Buy Volume, Sell Volume and Delta visible in the Data Window
Buy Volume, Sell Volume and Delta visible in the Data Window
🔍
Optional bar-volume filter by minimum and maximum total volume
Optional bar-volume filter by minimum and maximum total volume
🔢
Numerical delta value displayed inside every ribbon box
Numerical delta value displayed inside every ribbon box
📜
Up to 450 historical ribbon boxes
Up to 450 historical ribbon boxes
🎛
Adjustable ribbon height, opacity, borders, text size
Adjustable ribbon height, opacity, borders, text size
🆓
Free for all TradingView users with footprint data access
Free for all TradingView users with footprint data access
Note: Access to native footprint data requires a TradingView plan that supports request.footprint(). Data availability can also depend on the selected market and symbol. The current candle’s delta can change as new transactions are received — use completed candles when comparing historical values.
More from PropTraderz
proptraderz.com — NQ & ES Futures Trading