P
Indicators starting with P
-
Prop AlgoV1
🧠 PropAlgoV1 — Advanced Automated Trade Signal Engine by PropTraderz PropAlgoV1 is a professional-grade NinjaTrader 8 indicator developed by PropTraderz to help traders identify high-probability market entries through a combination of trend confirmation, volatility filters, and adaptive SuperTrend logic.It combines multiple classic and modern technical analysis tools into a single unified trading framework — aiming to simplify decision-making without oversimplifying market structure. ⚙️ Core Concept At its heart, PropAlgoV1 is a signal generator that synchronizes four powerful engines: SuperTrend Logic – defines short-term trend direction and reversal triggers. MACD Momentum – confirms momentum shifts using histogram acceleration. EMA Bias (150 & 250) – identifies higher-timeframe market bias. HMA…
-
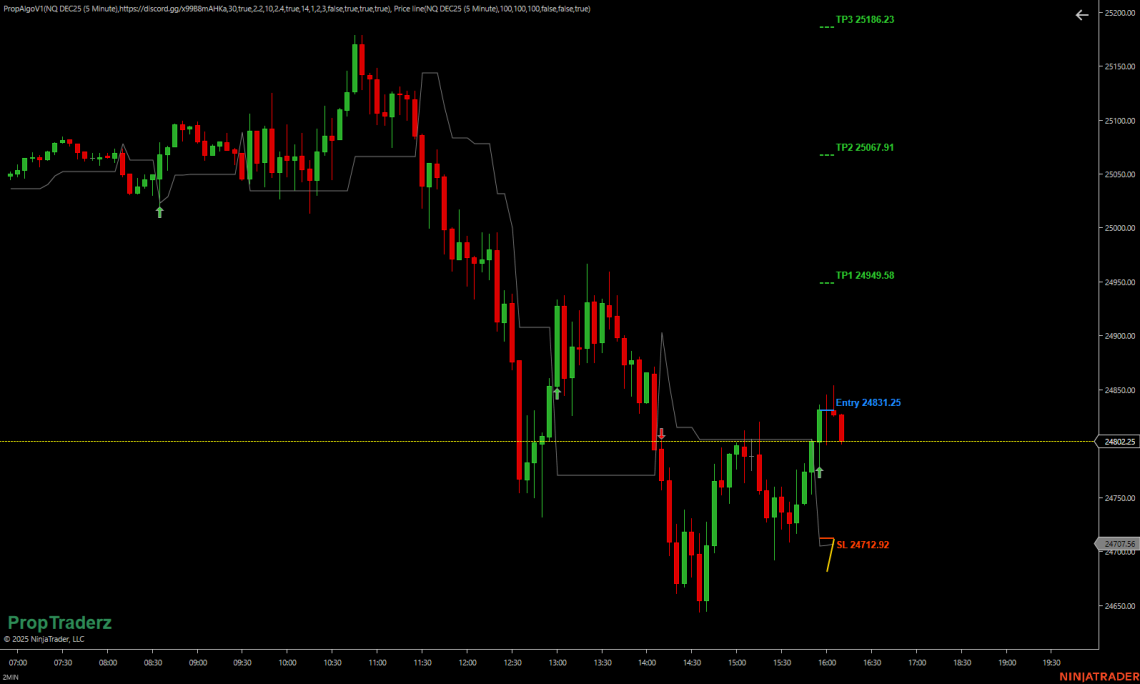
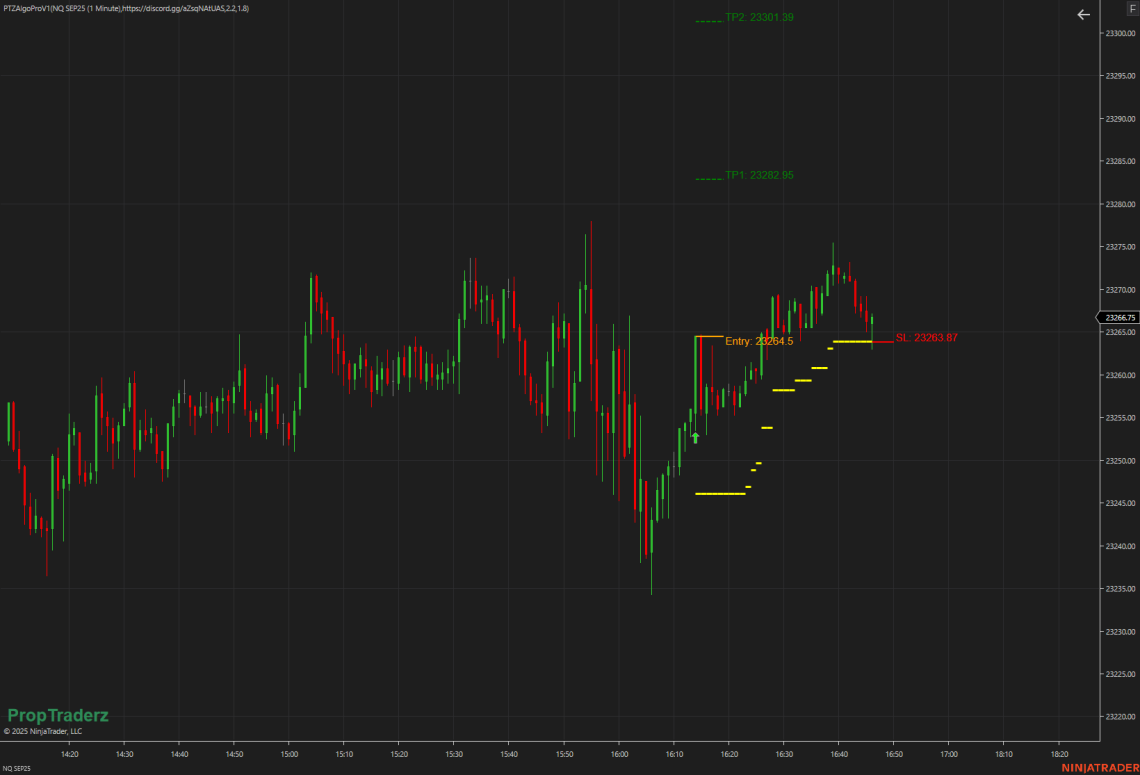
Algo ProV1
What It Does AlgoProV1 blends a tried‑and‑true SuperTrend trend filter with an ATR‑based stop‑loss that trails and plots clear profit targets—so you can focus on trading, not chart clutter. Trend Detection Computes a “SuperTrend” line by taking the average of high/low/close/open (HLCO) and offsetting it by ATR×Sensitivity. When price crosses above the upper band, a long signal is triggered; crossing below the lower band gives a short signal. Entry arrows mark the exact bar of the SuperTrend flip. Dynamic Stop‑Loss (SL) On entry, SL is set at entry ± ATR×SLFactor. As the trade progresses, the indicator recalculates ATR×SLFactor each bar. Only if this new level is more protective…
-
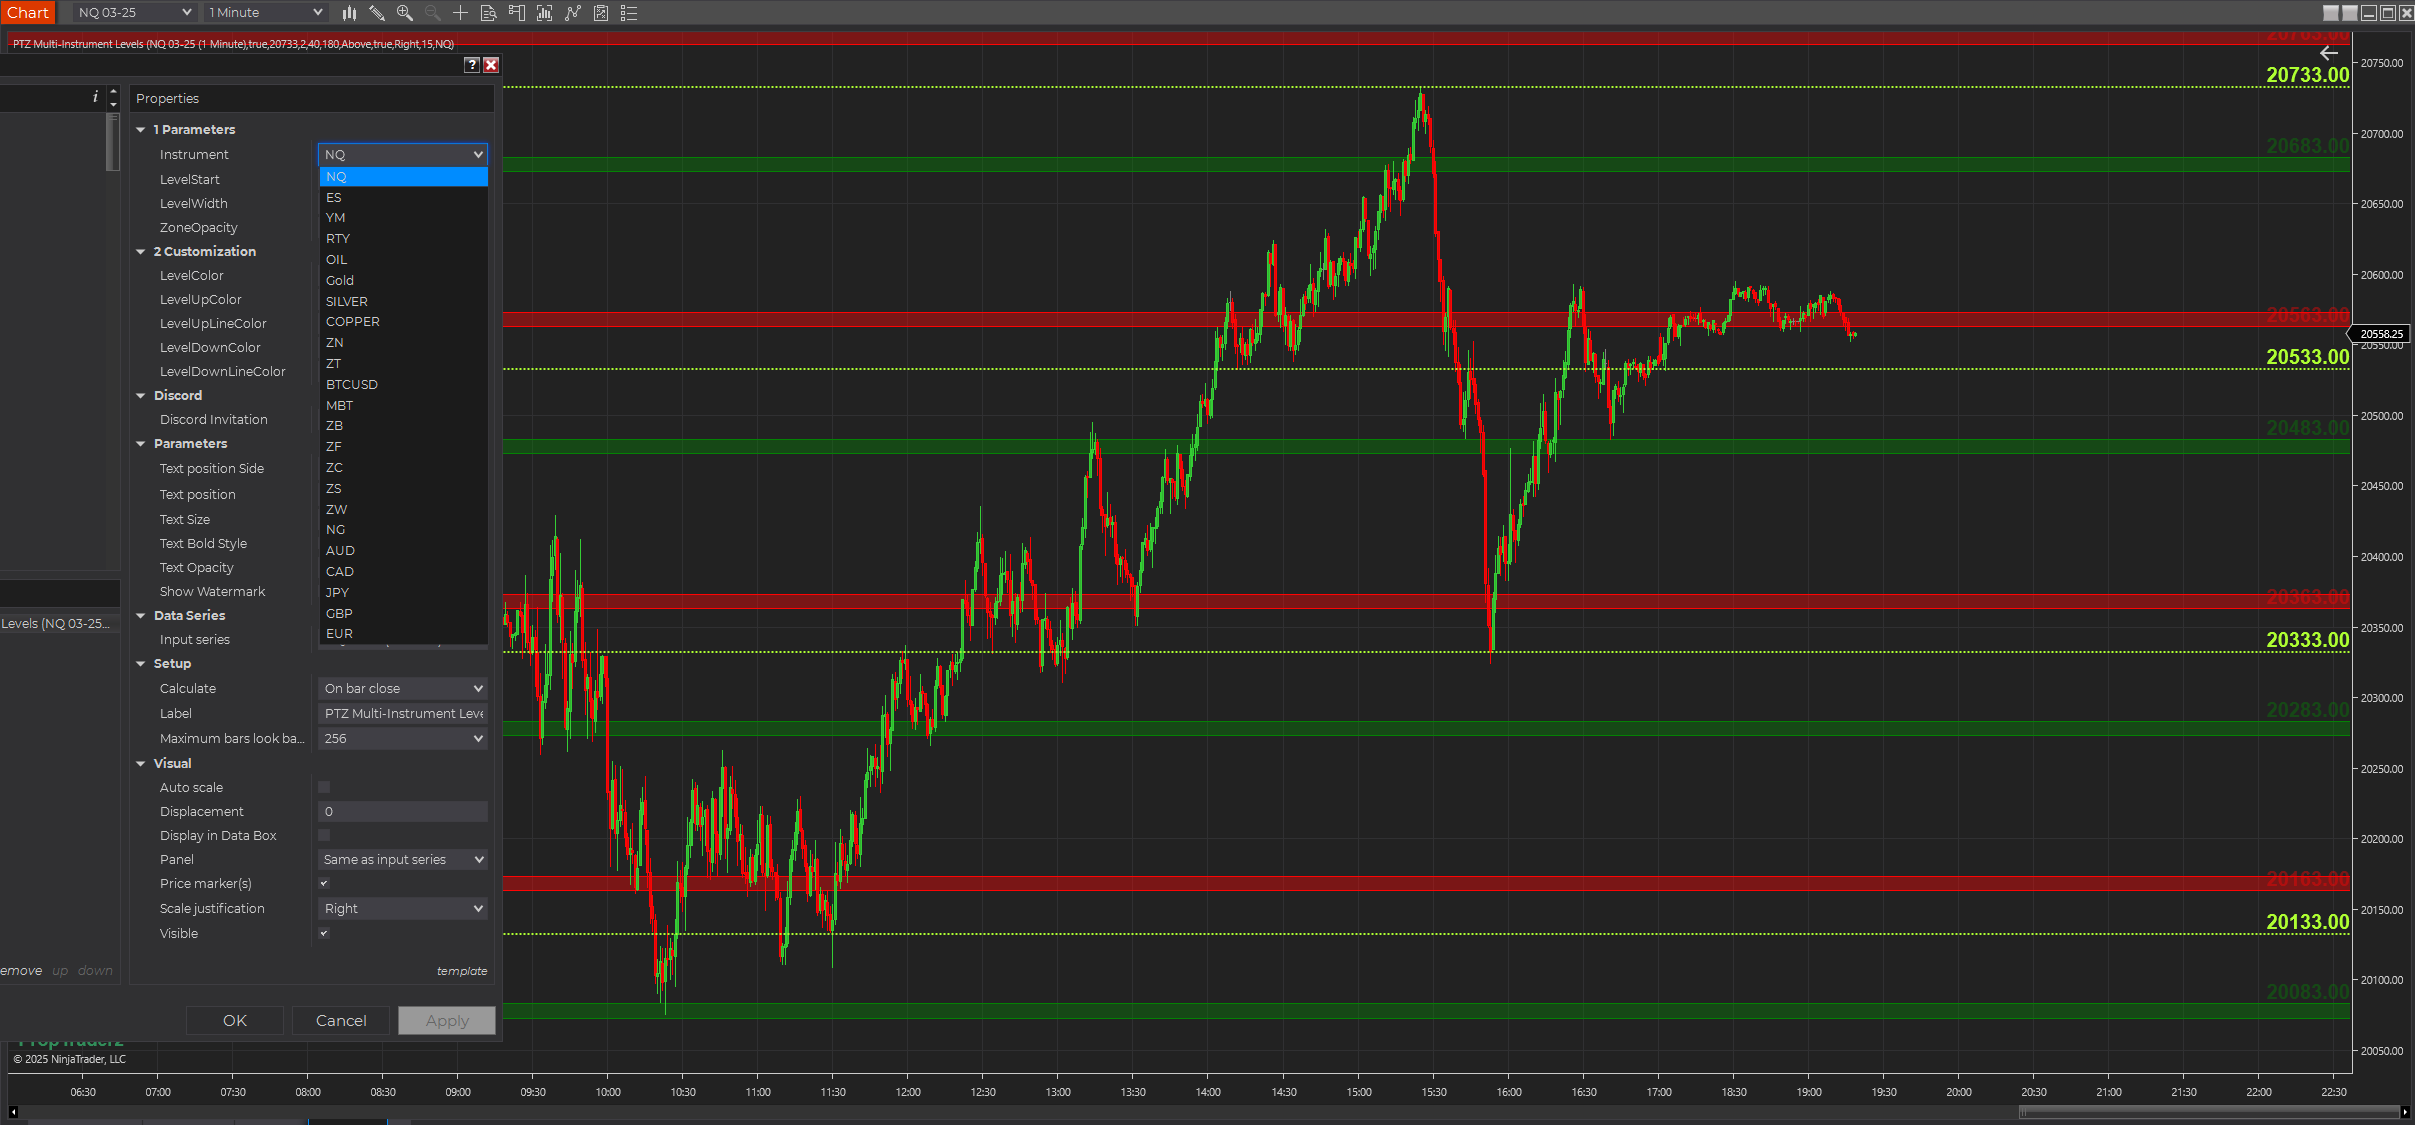
PTZ Multi-Instrument Levels
PTZ Multi-Instrument Levels Advanced Support & Resistance for NinjaTrader 8 This indicator helps you identify and visualize Advanced Support & Resistance for NinjaTrader 8. The PTZ Multi-Instrument Levels indicator is a great tool. Designed for traders who deal with multiple assets, this indicator automatically plots significant price levels, highlighting areas of interest with customizable zones. The PTZ Multi-Instrument Levels indicator is built to automatically detect and plot support and resistance levels for a wide range of instruments, including forex, futures, and crypto. It helps traders identify key levels where the price is likely to react, making it easier to spot potential trade setups. Key Features: ✅ Multi-Instrument Support –…
-
PTZ_ScalpTraderV1 Indicator Free
Overview of PTZ_ScalpTradeV1 The PTZ_ScalpTraderV1 indicator works by plotting three moving averages on your chart: two fast-moving averages and one trend-moving average. It also highlights the area between the two fast-moving averages as a “tunnel.” The indicator generates buy and sell signals based on the relationship between the price and these moving averages, helping traders identify potential trading opportunities in trending markets. By default, the indicator has the values I use. The best time frame I found to be is 3 Min charts. Works well also on other charts, like Renko, Tick,etc Avoid taking signals long if the cloud is hiding down, or short when the cloud still hiding up.…
-
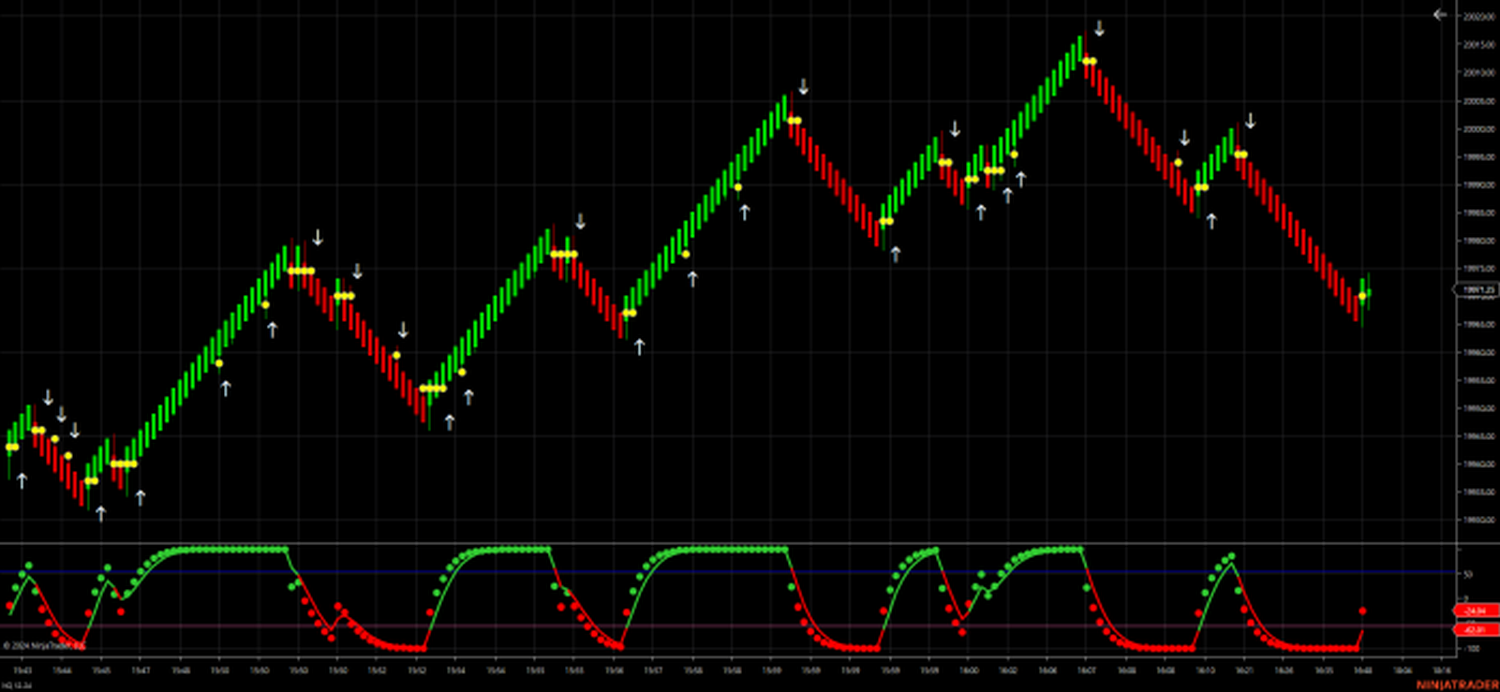
PTZ Wave
The PTZ Wave indicator leverages historical price data to plot Exponential Moving Averages (EMAs) in real-time. It calculates two sets of EMAs (fast and slow) to create a series of wave plots. 1. Historical Data Analysis: The indicator utilizes historical price data to initialize EMA values, ensuring accurate wave patterns from the start. 2. EMA Calculation: It calculates the fast EMA using a specified period (default is 5). The slow EMA is then calculated from the fast EMA. This dual EMA setup helps capture short-term and long-term trends. 3. Real-Time Plotting: As new price data arrives, the indicator updates the EMA values and plots the waves in real-time, reflecting current…
-
PTZ Linear Regression Channel Free
PTZ Linear Regression Channel Indicator Overview: The PTZ Linear Regression Channel Indicator is a powerful tool for traders utilizing the NinjaTrader platform. This indicator helps you visualize the trend and potential reversal points by plotting a linear regression channel on your price chart. It includes customizable bands based on standard deviations, allowing for a tailored analysis to suit your trading strategy. Features: Linear Regression Line: Plots the main regression line based on the specified period. Customizable Period: Adjust the number of bars used for the calculation to fine-tune the regression line. Standard Deviation Bands: Includes two customizable bands that represent standard deviations from the main regression line, aiding in identifying…
-
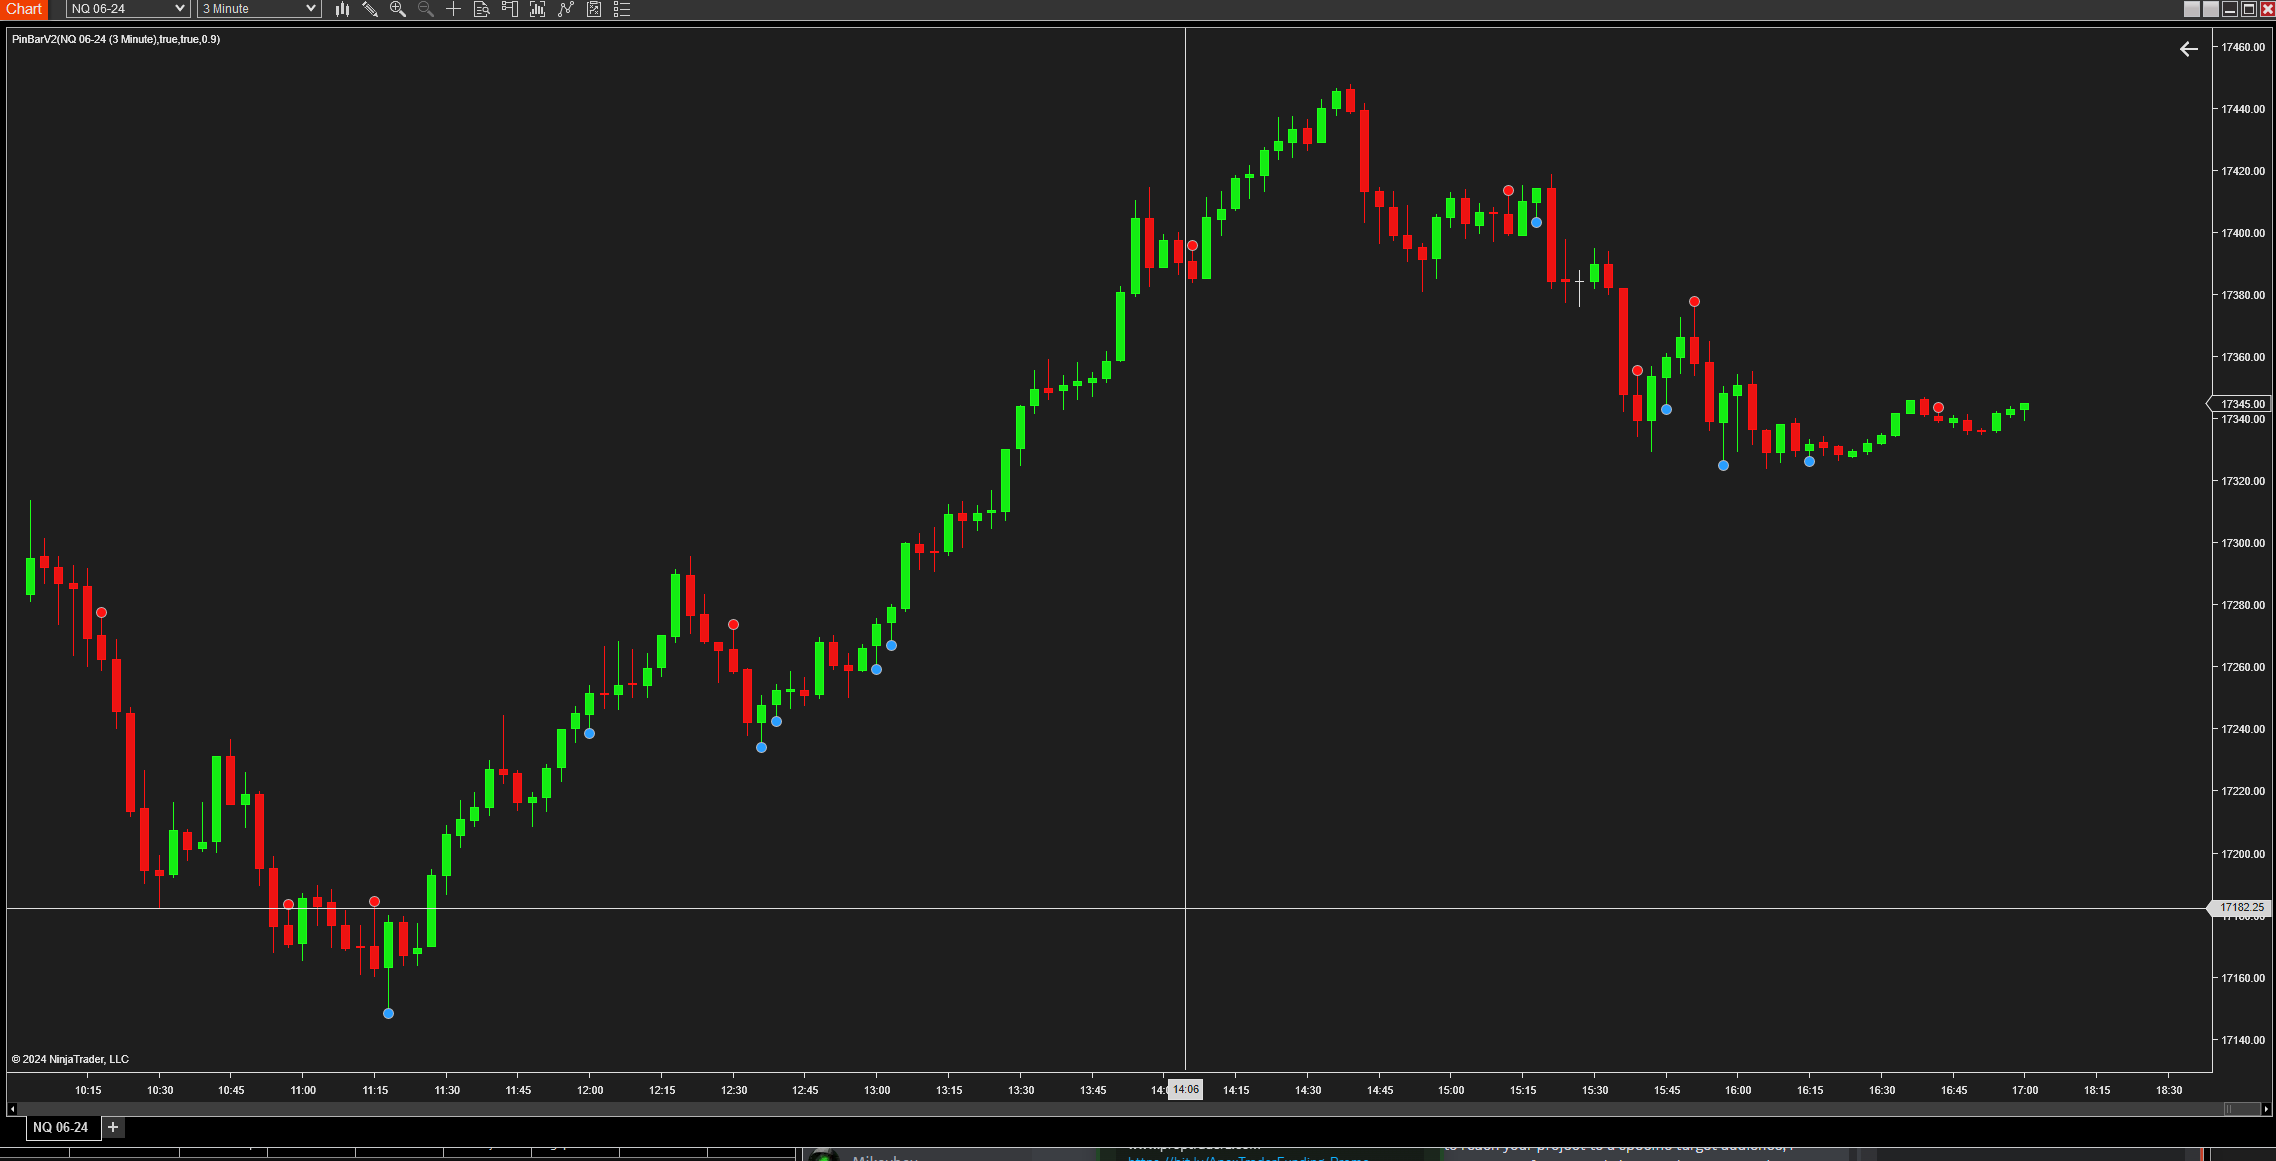
Pin Bar Free Indicator
Pin Bar Indicator for NinjaTrader The Pin Bar Free Indicator is a robust tool designed for the NinjaTrader platform that identifies pin bar formations, which are key signals of potential market reversals. This indicator detects both bullish and bearish pin bars, offering traders a powerful method to spot high probability entry and exit points based on price action. Features: – Automatic Detection: Scans charts in real-time to identify the formation of bullish and bearish pin bars. – Customizable Sensitivity: Features an adjustable threshold multiplier that allows traders to set the sensitivity of pin bar detection, catering to both conservative and aggressive trading styles. – Visual Alerts: Marks identified pin bars…
-
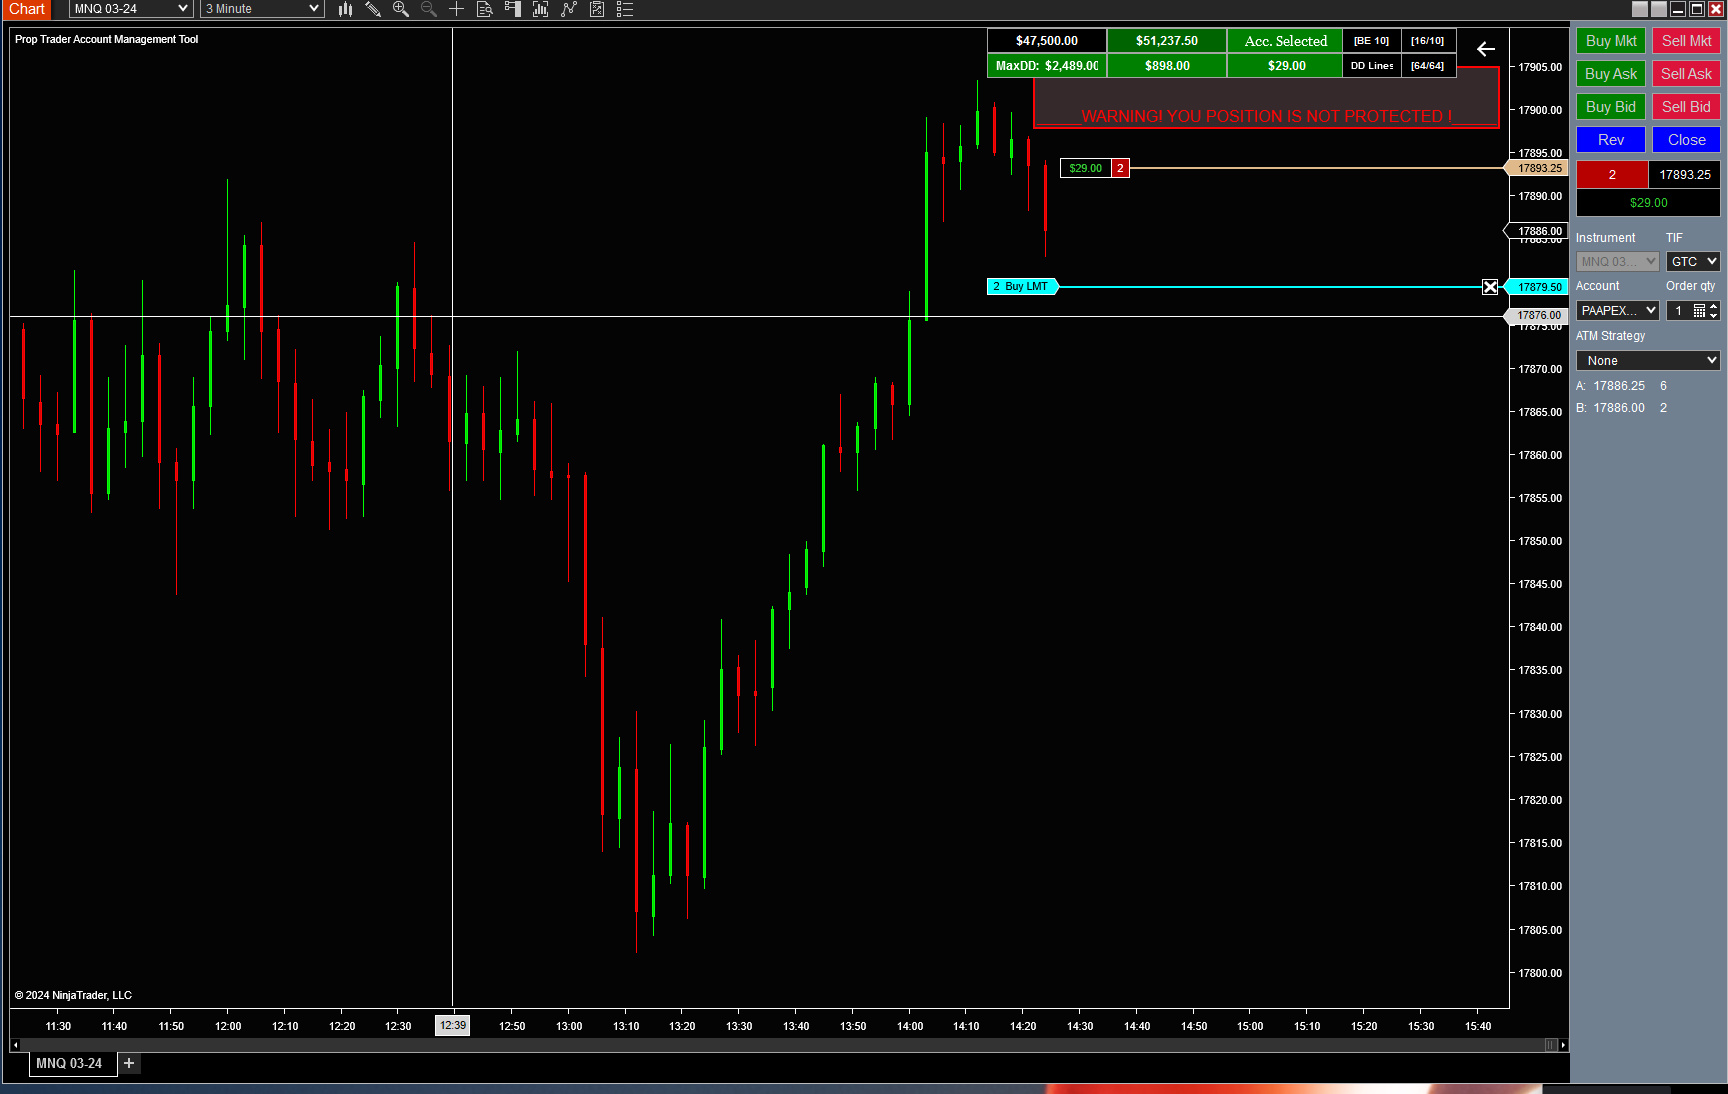
Prop Trader Account Tool
Prop Trader Account Tool The Prop Trader Account Tool is an indispensable instrument for any Prop Trader, it displays your Trailing Drawdown and Trailing Threshold in real-time, along with other vital Account statistics. It also visualizes three specific percentage levels of your Drawdown on the chart, assisting you in maintaining a robust account. The tool includes options for a flexible Stop Loss at break-even or a Trailing Stop, as well as bracket orders for those who opt for them. When using first time on an account check box after inserting the values of the existing account!! The Prop Trader Account Tool now issues a cautionary alert if there is no…
-
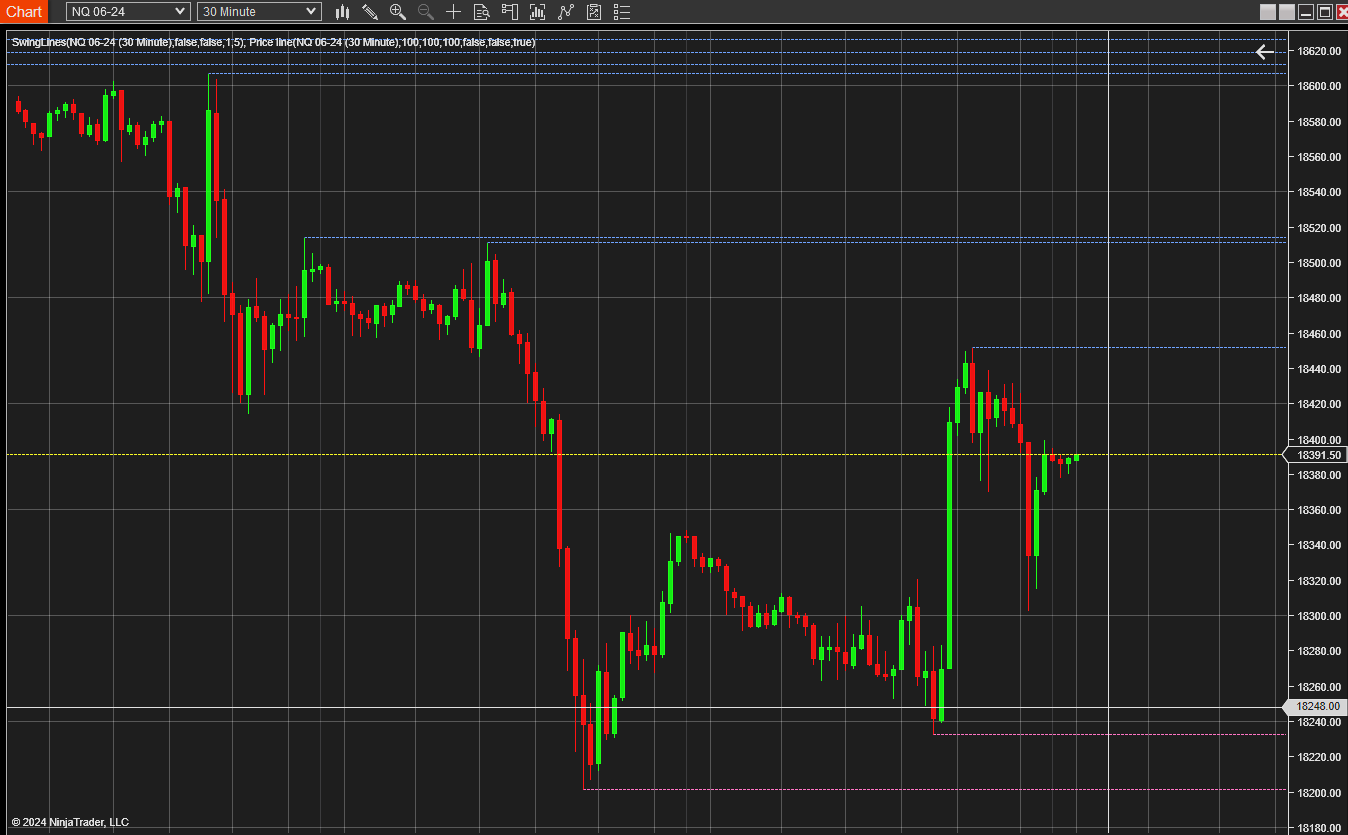
PriceActionSwing
This indicator for NinjaTrader 8.0 calculates swings in different ways and visualizes them. It shows swing information like the swing length, duration, volume, etc. It contains a lot of features and it is useable in the Market Analyzer. Strategies based on older PriceActionSwing versions will not work with this update. Remove old PriceActionSwing versions (do a backup first) before you import the updated version. The package contains two indicators: PriceActionSwingPro – Swing indicator with visualization and swing information – ABC patterns – Compute divergences based on different indicators – Naked swing lines – Swing statistics – Draw Fibonacci extensions and retracements automatically PriceActionSwingOscillator – Swing trend and relation visualization –…
-
Planned Level Visualizer
Planned Level Visualizer Planned Levels Visualizer is a little, easy-to-use, and free tool for NinjaTrader 8 used for displaying price level stripes on price charts. It is aimed to help any discretionary trader to save some time that is usually being spent on manual drawing stripes of levels. Example of the file text you need and how to create it watch here is very easy Here can download a text file with Es levels, remember in order to plot levels on each day you must change the date in the file every day and keep the date format you see in the file Planned Levels Visualizer is a little,…