-
Hammer Candlesticks Ninja Trader Addon
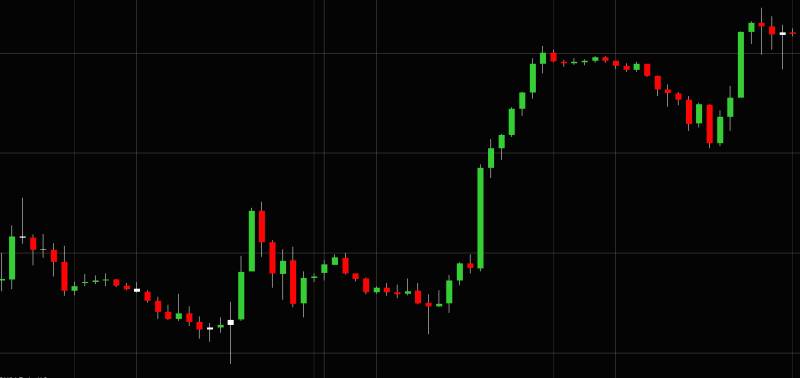
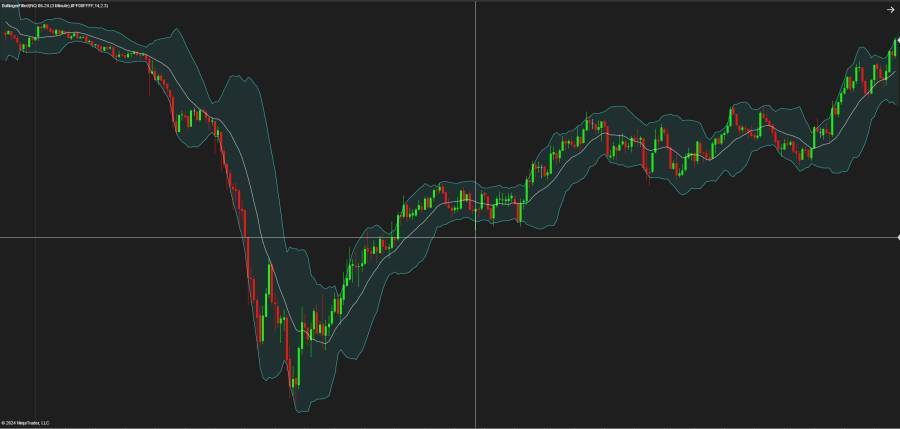
Hammer Candlesticks Ninja Trader Addon A simple script that changes the colour of the candle if the wick is larger than the candle snippet by WeyldFalcon . This script colours ‘Hammer/Inverted Hammer’ Bars based on percentage ratio Wicks/(High-Low). In addition, one can play sounds attached to the signal bars. Both Bar Color and Sound signals can be switched on/off by users in the indicator properties windows. KEY TAKEAWAYS Hammer candlesticks typically occur after a price decline. They have a small real body and a long lower shadow. The hammer candlestick occurs when sellers enter the market during a price decline. By the time of market close, buyers absorb selling pressure and push the…
-
Ninja Trader toolbar with labeled lines
Ninja Trader toolbar with labeled lines here a few off al features included ⇓ Fibonacci extensions and retracements OrderFlow Volume Profile Angled Line Line, ray and extended line combined Channel GanFan Trend channel tool designed for simplicity Support Line Perfectly horizontal support/resistance line Range Perfectly horizontal trend channel Measured Move Measure 2 equal legs Measure Take measurements between 2 points Arrows 4 more arrow markers with custom size Notes Predefined annotations and multilines text wrapping Standard & Third Party Drawing Tools Pin any drawing tool for quick access Plot Executions Button Plot your trade executions with markers only or text + markers Snipping Tool Button Run Windows snipping tool to…
-
Market Generate Information (MGI)
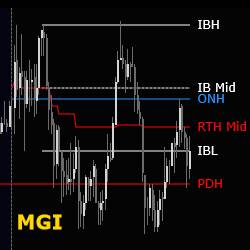
Market Generate Information (MGI) by Trinitas Trading Many thanks to Trinitas Trading for this great free tool for Ninja Trader. In order to download must go in Trinitas website and download the tool for free Downloads This free MGI (Market Generated Information) indicator automates the process of adding useful information on your chart to help identify trading opportunities, market context and areas of interest to help guide decision making. Three indicators are offered for daily, weekly and monthly time frames. MGI Market Generate Information (MGI) is a set of key data points and metrics used by traders and analysts in Market Profile analysis. These metrics provide valuable insights into the…
-
Market Structures Lite -Ninja Trader
The Market Structures Lite -Ninja Trader indicator shows Break Of Structures (BoS) patterns and various swing points (High-high, Low-low, High-low and Low-high). This is a light indicator not a full customized, but still make its job pretty good. After install you can find it in Ninja Trader indicators under the folder FxStill ⇒ SmartMoney For a more advance version can take a look HERE Enjoy!
-
Navigating the Trading Markets: Seasonality, Christmas Rally, and the Black Monday Event
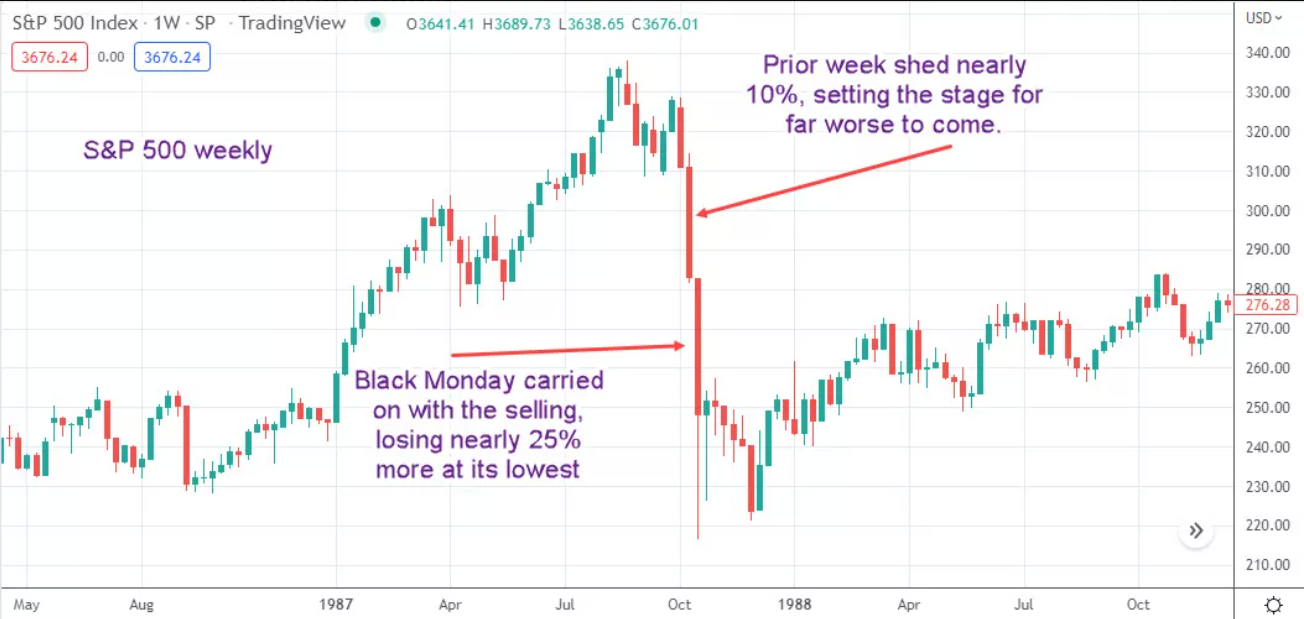
Introduction Trading in financial markets can be a complex and ever-changing endeavor. Traders and investors are constantly on the lookout for patterns, trends, and historical events that can provide valuable insights into market behavior. Two intriguing phenomena in the world of trading are “seasonality” and the “Christmas Rally.” Additionally, we’ll delve into one of the most infamous events in financial history: Black Monday. In this article, we’ll explore these concepts, providing a deeper understanding of how they impact trading markets. Understanding Seasonality Seasonality refers to the tendency of financial markets to exhibit recurring patterns or trends during specific times of the year. These patterns can be attributed to various factors,…
-
Bar Counter-NinjaTrader
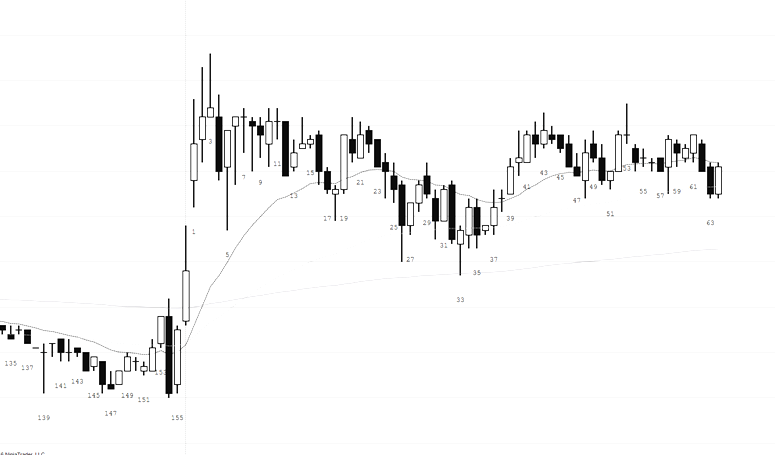
Al Brooks style Bar Counter-NinjaTrader which places the number of the bar below every other bar starting at 1 for the first bar of each session. You can change the text size and color, place text below or above price bars, change the distance below/above a price bar, show either odd or even numbers. This is a different bar counter for renko bars
-
Clean Chart AddOn
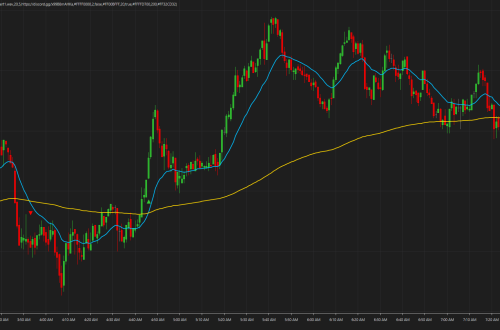
Clean Chart AddOn indicator it’s for you to do your analysis, again and again, and you don’t want to delete the previous analysis part. This indicator removes the text from the top of the chart and keeps it clean, it also works to clean the chart during a previous analysis, or you can keep two analyzes at the same time, you can also keep the Chart clean at the time you want to leave it blank, here I leave a small video for you to see how it is used, I hope you enjoy it utility.
-
Liquidity Index for NT8
Liquidity Index for NT8 Liquidity is one of the most important signals traders can pay attention to in the market. It shows how market participants are feeding the price levels. It is not only with limit orders but also related with the speed that traders and institutions can answer for new price actions. Liquidity comes along with Volatility because they are proportional inversely and for the complete technical analysis over market movement, traders must watch both signals. QuantWise Trading provide this indicator as open code, and we explain the original concept and its respective algorithm. ∆L= ∆V/∆P Knowing that the liquidity variation is the volume variation over the price…
-
Session Pivots Monthly (amaPivotsMonthly)
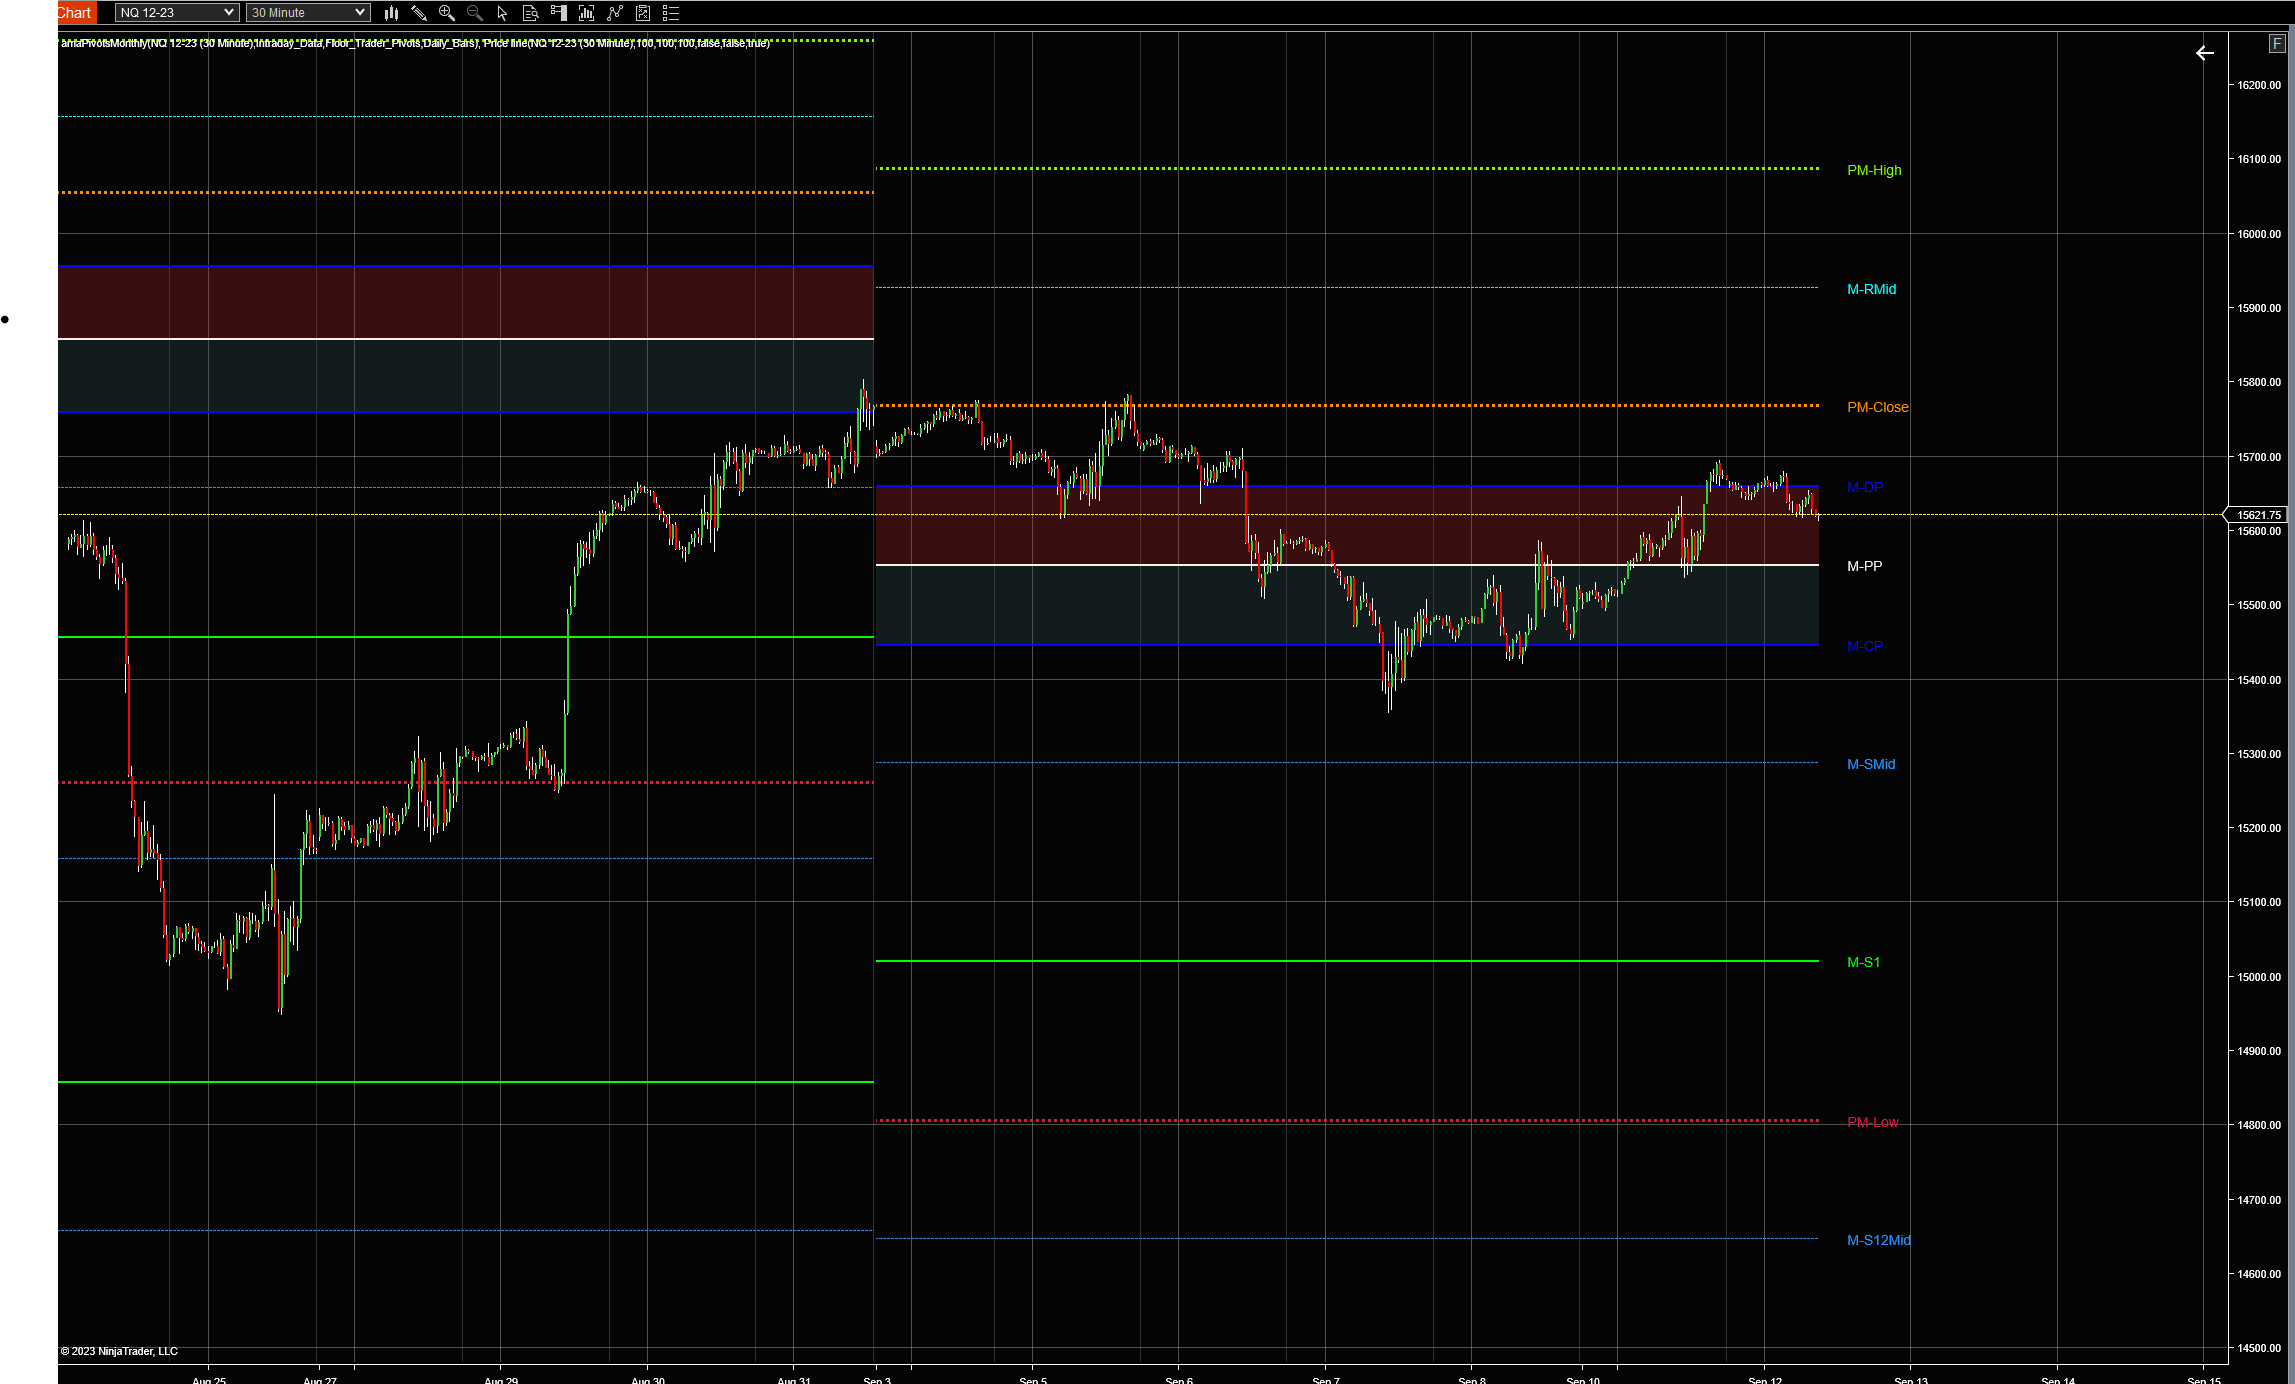
The Session Pivots Monthly (amaPivotsMonthly) is an enhanced pivots indicator which allows for displaying floor pivots, wide pivots, Jackson Zones and Fibonacci pivots. All pivots are calculated from daily bars (default setting) or from the bar series that has been selected as input series. The indicator may be used to display ETH pivots on a full session chart or RTH pivots on a regular session chart. It is not designed to display RTH pivots on a full session chart. When pivots are calculated from daily bars, they are typically calculated from the full session high, the full session low and the settlement price. However, the daily data depends on the data…
-
Obsidian Autotrader TradingBot
Obsidian Autotrader TradingBot Obsidian Autotrader is an automated trading system for the NinjaTrader platform. It is designed to trade futures contracts using a combination of technical indicators and price action analysis. The system was created by CJ Chun, a professional trader with over 10 years of experience. He claims that Obsidian Autotrader has been profitable in backtesting and live trading. A 45% OFF discount code for this Autotrader with code monicap45 Features Obsidian Autotrader uses a variety of technical indicators and price action analysis to identify trading opportunities. The system can also be customized to fit the individual trading style of the user. Is working on a customized O-renko bar,…

