
Liquidity Hunter
Get the free NinjaTrader 8 indicator and start using it on your charts.
Liquidity Hunter
Login / Register to DownloadMarket Structure Tool
What Liquidity Hunter Shows
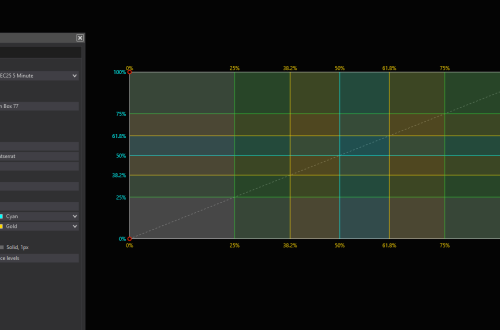
Liquidity Hunter is designed to help NinjaTrader 8 users visualize important liquidity areas, swing structure, previous high and low references, premium/discount zones, supply/demand areas, BOS/CHoCH structure shifts, order blocks, and FVG-style imbalance zones directly on the chart.
Liquidity Zones
Plots swing high and swing low liquidity areas with optional boxes, lines, and bubble markers.
Market Structure
Highlights HH, HL, LH, LL, Break of Structure, and Change of Character labels.
Supply & Demand
Displays premium and discount areas as potential supply/sell and demand/buy zones.
Indicator Features
Key Features
Why Traders Use It
Why Liquidity Hunter Can Help
Liquidity is one of the most important areas to watch in futures trading. Price often reacts around previous highs, previous lows, swing points, imbalance areas, and zones where traders may have stops or pending orders resting.
Liquidity Hunter helps bring those areas directly onto your NinjaTrader chart, making it easier to identify possible reaction zones, structure shifts, previous session references, and premium or discount areas.
Chart Elements
Main Elements Explained
| Element | What It Helps With |
|---|---|
| Liquidity Boxes | Highlights swing high and swing low liquidity areas. |
| Previous High/Low Lines | Shows previous day, week, and month high/low references. |
| Supply/Demand Zones | Marks potential sell and buy reaction areas. |
| BOS / CHoCH | Identifies structure breaks and character changes. |
| FVG-Style Zones | Highlights imbalance-style areas that may become future reaction zones. |
Appearance Settings
Fully Customizable Colors
The indicator includes multiple appearance settings so you can match it to your own chart theme.
Installation
How to Install Liquidity Hunter
- Download the indicator file from the download button above.
- Open NinjaTrader 8.
- Go to Tools → Import → NinjaScript Add-On.
- Select the downloaded file.
- Open a chart, right-click, then choose Indicators.
- Search for Liquidity Hunter.
- Add it to your chart and adjust the appearance settings as needed.
Important Note
Liquidity Hunter is a charting and visualization tool. It does not predict market direction and should not be used as a standalone trading system. Use it together with your own trading plan, confirmation rules, risk management, and market context.
Disclaimer
This indicator is provided for educational and informational purposes only. It is not financial advice, investment advice, or a guarantee of trading results. Futures trading involves substantial risk and is not suitable for every trader. Always trade with proper risk management.
Provided free by PropTraderz · www.proptraderz.com